
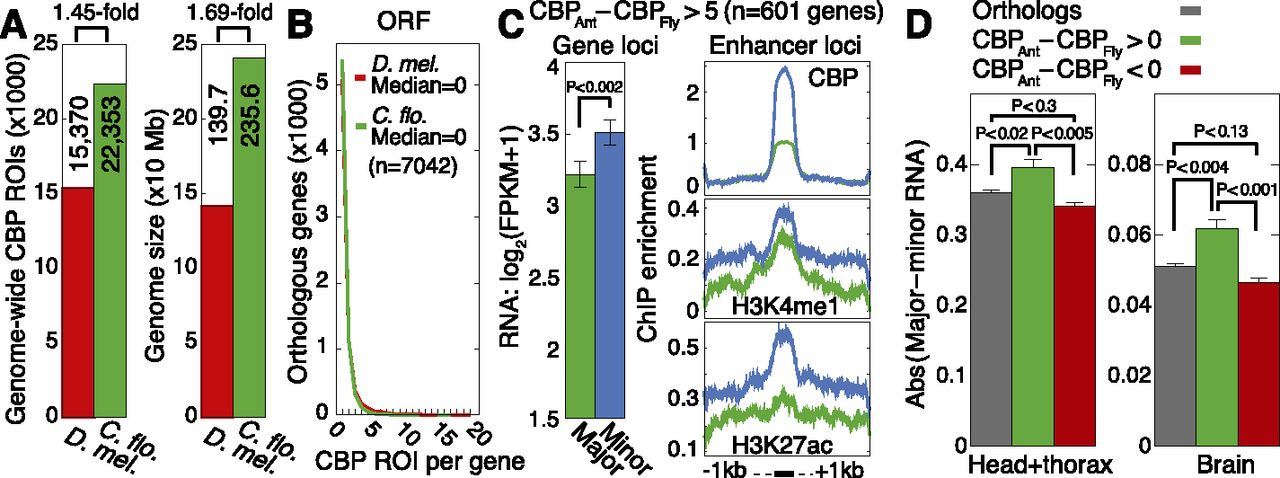
Genes with evolutionarily increased CBP binding exhibit increased caste variability. (A) Comparison of significant CBP ROIs identified by the same method and parameters using adult female ChIP-seq data for D. melanogaster and C. floridanus. Total significant ROIs are indicated on left (P < 0.05) and total assembled genome sizes are indicated (in megabase pairs, Mb) on right. (Uextra and mitochondrial chromosomes are excluded for Drosophila). (B) Distributions of CBP ROIs occurring within open reading frames (ORFs; exons+introns) of orthologous genes (n = 7042 orthologs). (C) Comparison of mRNA expression (left) and ChIP enrichment (right) between majors and minors for 601 genes showing more than five CBP ROIs in ants compared with flies; similar results found using different cutoffs (data not shown). Error bars denote SE over genes. ChIP enrichment profiles are shown for CBP, H3K4me1, and H3K27ac averaged over the CBP ROIs located within 50 kb of these ant CBP-enriched genes. (FPKM) Fragments per kilobase per million (mapped) reads (proxy for mRNA expression level). (D) Absolute difference in log2(FPKM+1) mRNA expression between majors and minors for 7042 orthologs (gray), 1219 genes with at least one more CBP ROI in ants than flies (green), and 5562 genes with at least one more CBP ROI in flies than ants (red). RNA-seq data from head+thorax and brain tissues are shown. P-values estimated using a two-tailed Mann-Whitney U-test.


