
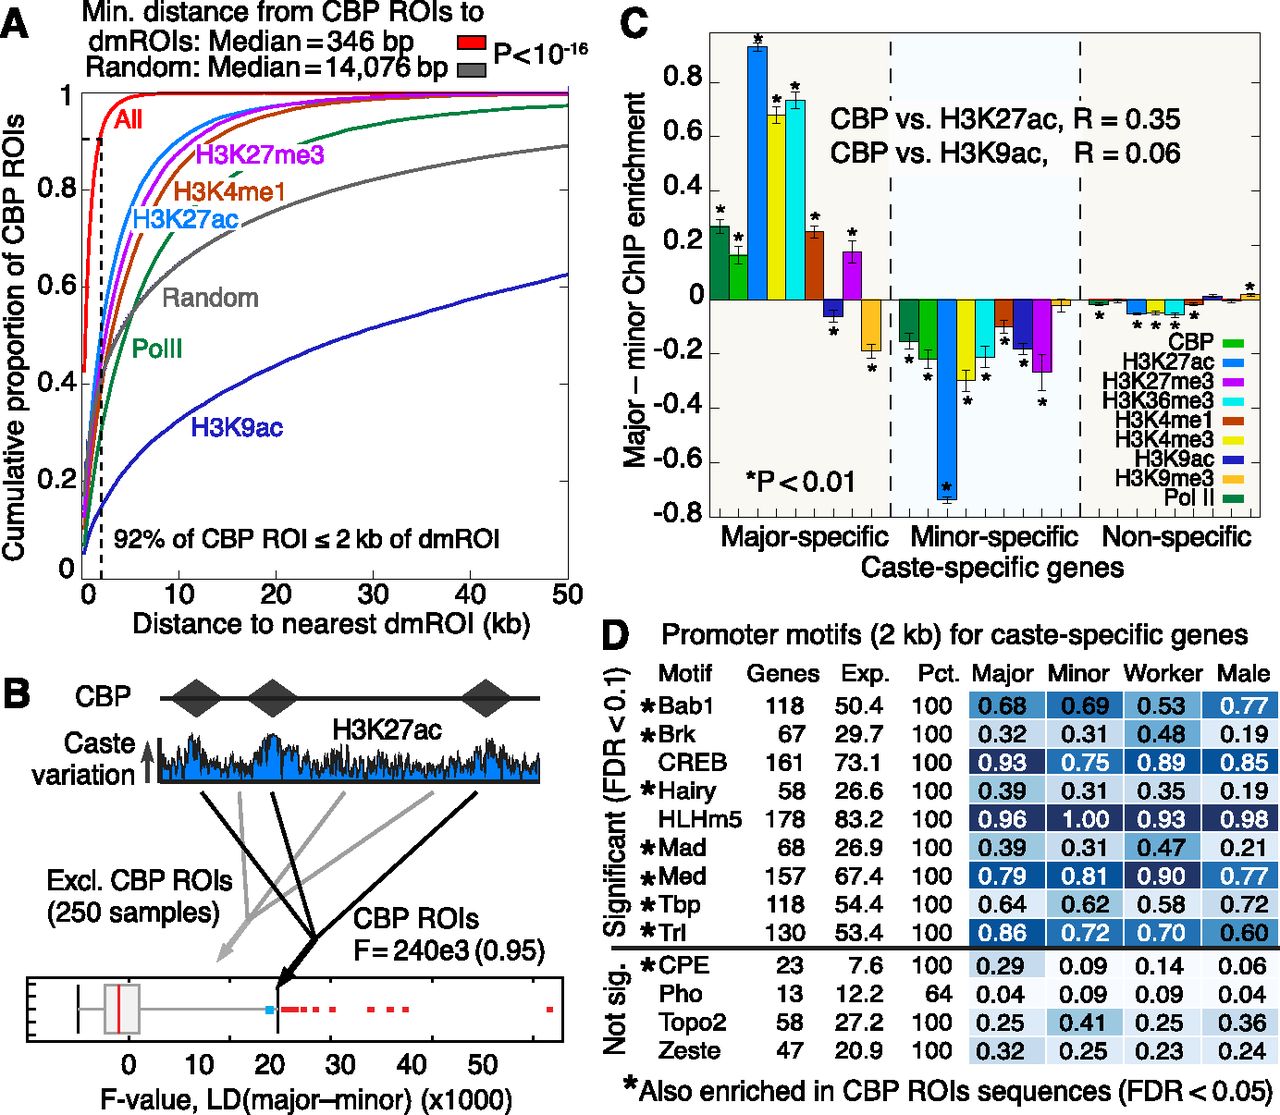
CBP colocalizes with dmROIs and identifies putative transcription factor binding partners. (A) Cumulative distribution of distance (kb) from a CBP ROI to the nearest dmROI. “All” curve computed using the pool of all dmROIs for PTMs and Pol II (n = 161,401). “Random” curve computed using the average distribution obtained by randomly generating 161,401 ROIs with the observed ROI length distribution (n = 100 replicates). Error bars for “Random” curve denote SE over replicates. Dashed line marks 2-kb distance, which accounts for 92% of CBP ROIs. (B) Linear discriminant (LD) analysis for H3K27ac ChIP enrichment using all 22,353 CBP ROIs (diamonds in cartoon). F-value denotes observed caste separation of H3K27ac at CBP ROIs. Boxplot shows distribution of 250 random F-values obtained by LD analysis using the same number of ROIs drawn randomly genome-wide with lengths from Supplemental Figure 21A but excluding CBP ROIs. (C) Mean difference in ChIP enrichment between majors and minors for sets of major-specific, minor-specific, and remaining (nonspecific) genes. Error bars denote SE over genes. Asterisks denote significant deviation from 0 (one sample t-test, P < 0.01). R-values denote Pearson correlation of CBP versus H3K27ac or H3K9ac across caste-specific gene loci (gene body ±2kb), using ChIP enrichment values fitted by linear regression with RNA. (D) Nine TF motifs significantly enriched in promoters (2 kb) of caste-specific genes from worker and sex comparisons (FDR < 0.1). Seven of these motifs (denoted by asterisks) are also enriched in DNA sequences denoted by all CBP ROIs (FDR < 0.05). Four nonenriched TFs are shown as controls.


