
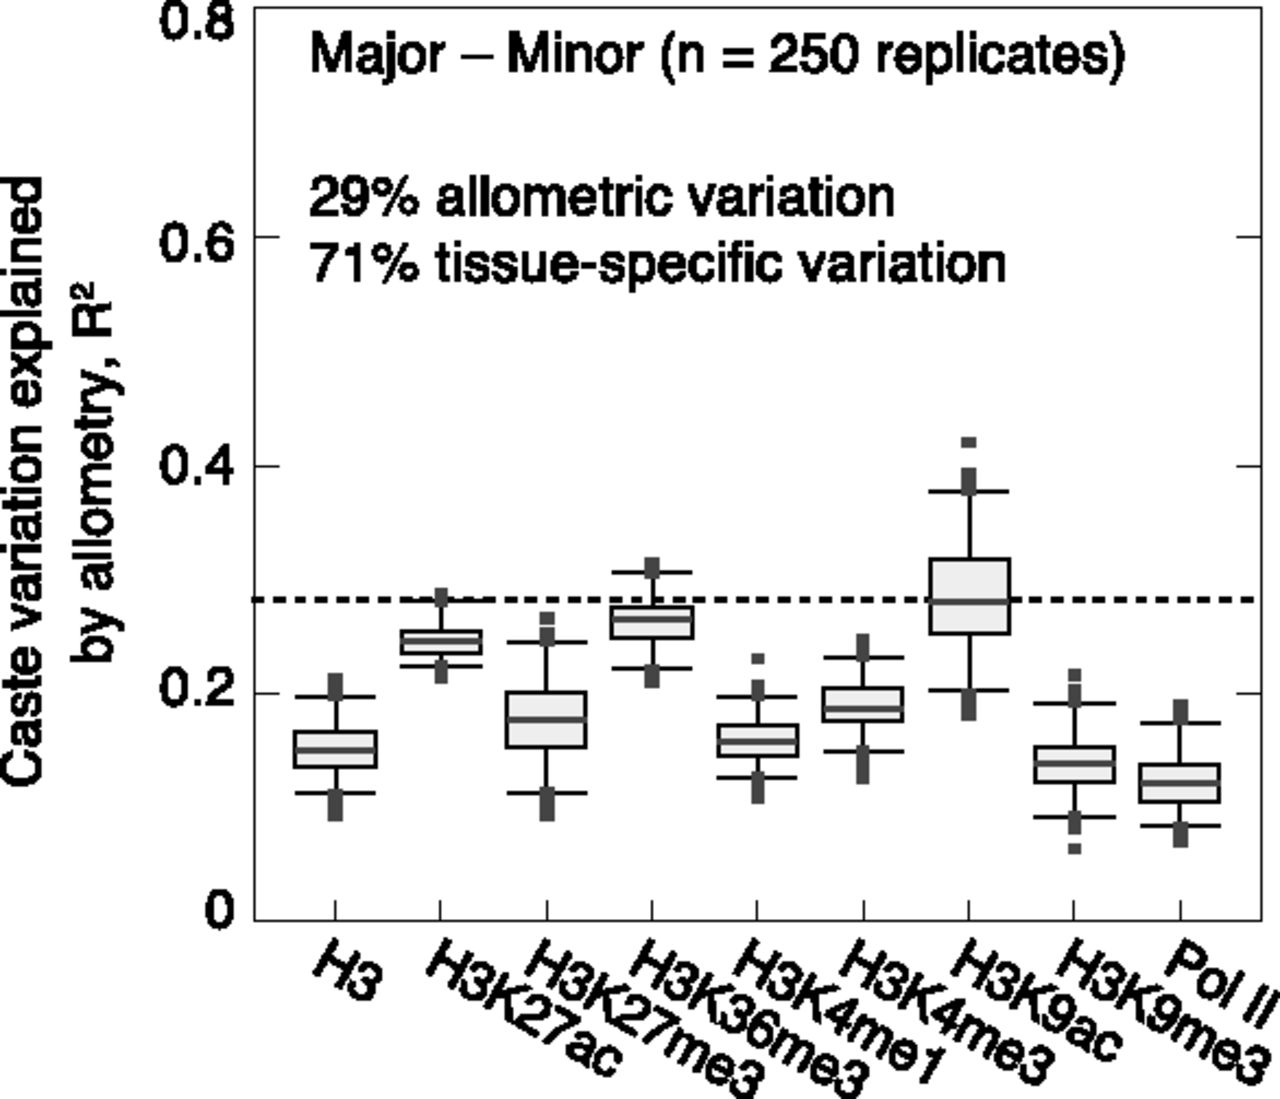
Estimates of the percentage of tissue-specific caste variation present in H+T data when comparing majors and minors. Shown are proportions of variation (in the distribution of ChIP enrichment differences for all protein-coding genes) explained by a linear regression model allowing allometry in 50 independent tissue types. Results for 250 simulated tissue-specific ChIP enrichment matrices are shown for each ChIP sample. See Supplemental Figure 18 for complete results and Supplemental Methods for more details. (Boxes) 25th–75th percentiles; (whiskers) 5th–95th percentiles; (points) outliers. Adjusted R2 values estimated by weighted least squares, with the same weights used for caste differential regression of RNA and ChIP data in Figure 3B.


