
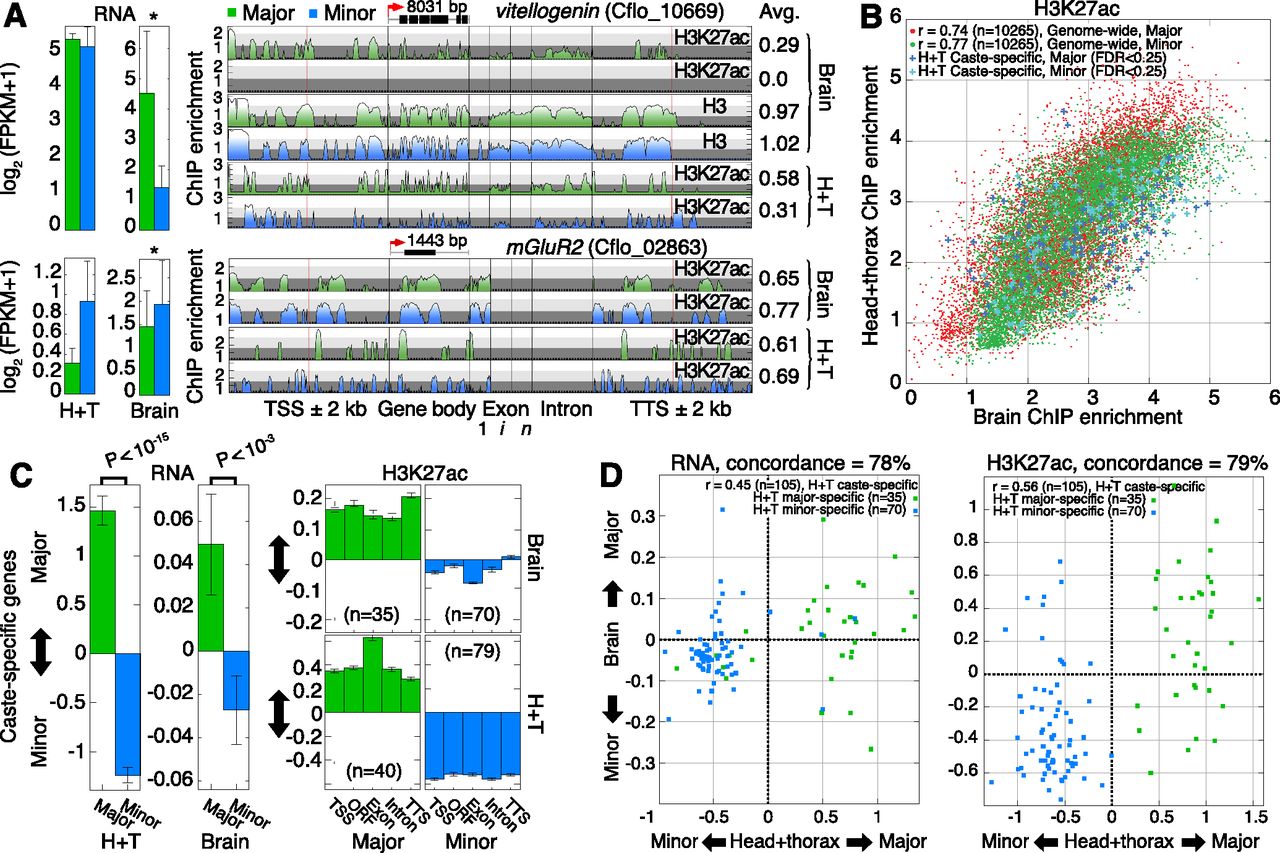
Ant brains exhibit caste-specific variability. (A) mRNA expression and ChIP enrichment tracks from brain and head+thorax (H+T) samples for two gene loci, vitellogenin and mGluR2. Asterisks denote significant differential expression (FDR < 0.25). Total H3 brain samples are shown for vitellogenin for reference. Gene length is indicated above each gene model. Average ChIP enrichment across each gene locus is reported on right. (TSS) Transcription start site; (Exon) first (1), internal (i), and last (n) exons; (TTS) transcription termination site; (kb) kilobase. (B) Scatterplot comparisons of H3K27ac ChIP enrichment between brain and H+T tissues, shown separately for major and minor data. Caste-specific genes identified from H+T data are highlighted in blue to show their enrichment in brain tissue. Pearson correlation coefficients are reported for each caste. (C) Mean changes in RNA (left) and H3K27ac ChIP enrichment (right) for H+T caste-specific genes (over TSS, CDS, Exon, Intron, and TTS), measured in brains and in H+T. Error bars indicate SE over genes. P-values estimated using a two-tailed Mann-Whitney U-test. (D) Scatterplot comparisons of major vs. minor differences in RNA (left) and H3K27ac (right) between H+T and brain tissue samples, for H+T caste-specific genes. Concordance statistics report the percentage of H+T caste-specific genes that exhibit the same direction of change (major or minor) in brain and H+T samples. (FPKM) Fragments per kilobase per million (mapped) reads (proxy for mRNA expression level).


