
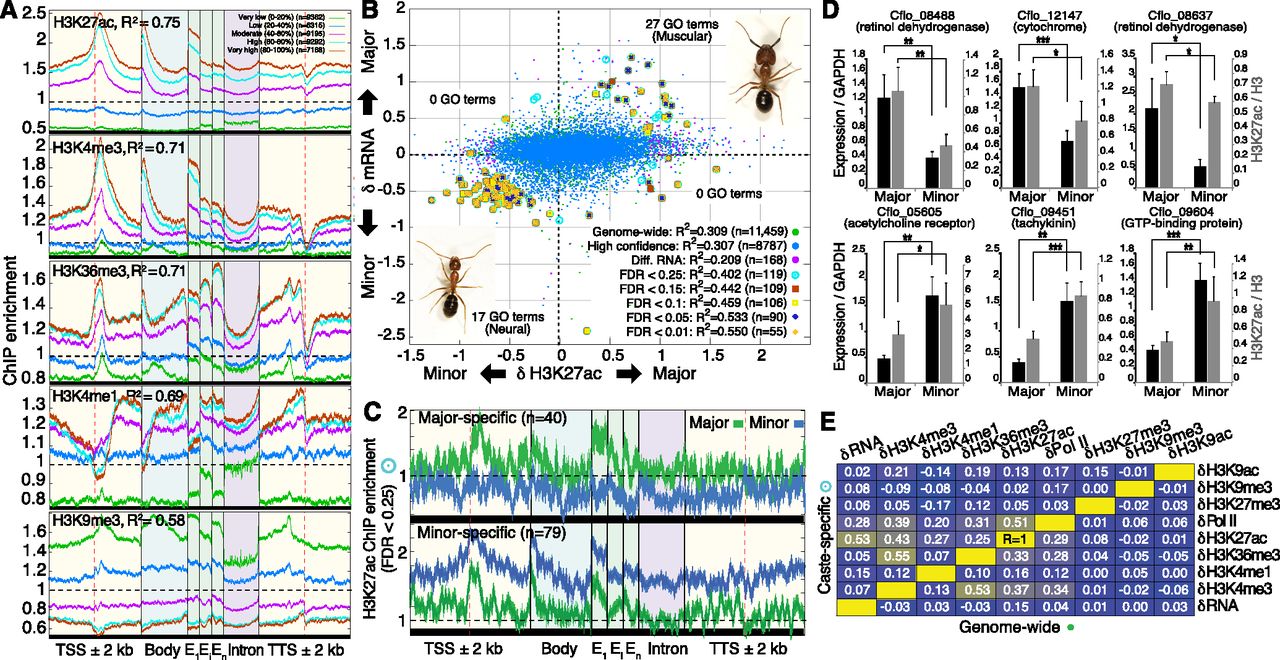
Changes in H3K27ac reveal caste-specific transcriptome states. (A) Meta-gene average ChIP enrichment profiles for five PTMs, pooling caste data. ChIP enrichment profiles are grouped into five expression categories (20th percentiles of the genome-wide distribution of gene expression levels). R2 values indicate ordinary least-squares regression fit of gene-proximal (gene body ± 2 kb) ChIP enrichment data to log2(FPKM+1) expression (Supplemental Table 4). Error bars denote SE over genes. (TSS) Transcription start site; (Exon) first (E1), internal (Ei), and last (En) exons; (TTS) transcription termination site; (kb) kilobase. (B) Relationship between the difference in log2(FPKM+1) expression levels (y-axis) and the difference in H3K27ac ChIP enrichment (x-axis) between majors and minors. ChIP enrichment data were fitted by linear regression to mRNA expression using 11,459 genes. “High-confidence” genes contain no missing data requiring imputation across gene loci. “Diff. RNA” genes have significant differential expression (FDR < 0.15) and are significant in a χ2 multivariate outlier analysis. “Caste-specific” genes also exhibit significant ChIP enrichment and are grouped by false discovery rate (0.25 < FDR < 0.01). See Supplemental Methods for further details. Numbers of significant GO categories enriched using caste-biased genes (i.e., passing multivariate outlier analysis but not necessarily with significant changes in expression or H3K27ac) from each quadrant are shown (FDR < 0.01). (C) ChIP enrichment profiles for H3K27ac over caste-specific gene loci (FDR < 0.25) for 40 major-specific genes (top) and 79 minor-specific genes (bottom). Error bars reflect 1 SE over genes. (D) Validation of caste-specific genes from B. RNA levels (black bars) were measured by RT-qPCR and normalized to GAPDH levels, which shows similar expression both among castes and among biological replicates within caste (i.e., similar standard errors; data not shown). H3K27ac enrichment (gray bars) were measured in 5′ promoters by ChIP-qPCR and normalized to total H3. See Supplemental Table 10 for primer sequences. Average and standard deviation over five independently founded ant colonies are shown. Significance assessed by two-sample, unequal variance t-test: (*) P < 0.05; (**) P < 0.01; (***) P < 0.001. (E) Pearson correlations of between-caste differences in ChIP enrichment between pairs of PTMs, RNA Pol II, and mRNA expression using either all genes (n = 11,459; bottom right diagonal) or caste-specific genes (n = 119; top left diagonal). Reported values indicate the averages from major vs. minor and male vs. female comparisons. (Yellow) R = +1; (dark blue) R = −1.


