
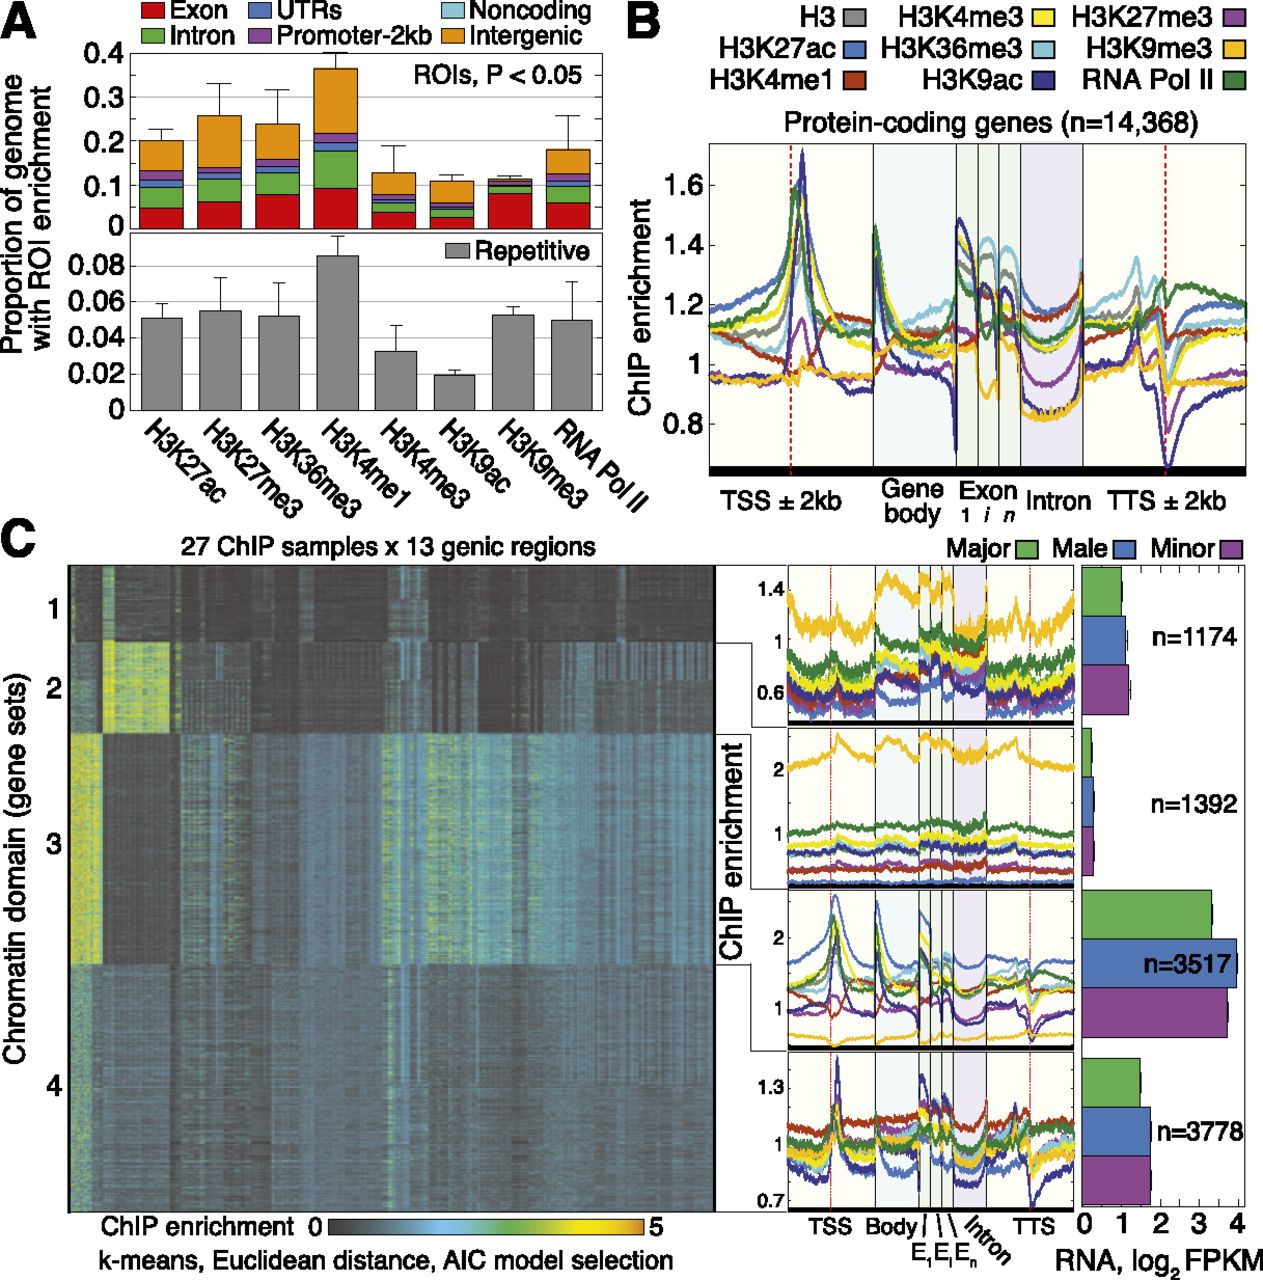
Genome-wide patterns of histone PTMs in Camponotus floridanus. (A) Prevalence of histone PTMs and RNA Pol II, partitioned into genic (Exon, Intron, 5′ and 3′ UTRs, 2-kb promoter), Noncoding,
and Intergenic groups. Prevalence was computed by counting nucleotides covered by significant regions of interest (ROIs; P < 0.05) and averaging over major, minor, and male estimates. Prevalence over repetitive DNA, defined here as sequences appearing
multiple times in the genome, is shown below (see Supplemental Fig. 6C for specific classes of repetitive elements); by this definition, ∼22% of the genome is repetitive
(Supplemental Methods). An ROI is considered repetitive if the majority of nucleotide loci delimited by this ROI are repetitive.
Error bars denote 1 standard error (SE) over castes. (B) Quantitative profiles of ChIP enrichment across gene loci,  ,…,
,…,  for ChIP samples p, averaged over castes and all protein-coding genes that contain significant PTM prevalence (14,368 genes). Error bars denote
SE over genes. (TSS) Transcription start site; (Exon) first (1), internal (i), and last (n) exons; (TTS) transcription termination site; (kb) kilobase. (C) Visualization of the 351-dimensional ChIP-seq data set summarized for 9861 protein-coding genes, grouped by k-means clustering
into k = 4 significant clusters (chromatin domains) using AIC model selection and a Euclidean distance measure. Columns were
grouped by hierarchical clustering with a Euclidean distance measure. (Middle) ChIP enrichment profiles averaged over gene loci from each chromatin domain. On right, average expression levels for genes in each chromatin domain, separated by caste. Error bars denote SE over genes. (FPKM)
Fragments per kilobase per million (mapped) reads (proxy for mRNA expression level).
for ChIP samples p, averaged over castes and all protein-coding genes that contain significant PTM prevalence (14,368 genes). Error bars denote
SE over genes. (TSS) Transcription start site; (Exon) first (1), internal (i), and last (n) exons; (TTS) transcription termination site; (kb) kilobase. (C) Visualization of the 351-dimensional ChIP-seq data set summarized for 9861 protein-coding genes, grouped by k-means clustering
into k = 4 significant clusters (chromatin domains) using AIC model selection and a Euclidean distance measure. Columns were
grouped by hierarchical clustering with a Euclidean distance measure. (Middle) ChIP enrichment profiles averaged over gene loci from each chromatin domain. On right, average expression levels for genes in each chromatin domain, separated by caste. Error bars denote SE over genes. (FPKM)
Fragments per kilobase per million (mapped) reads (proxy for mRNA expression level).


