
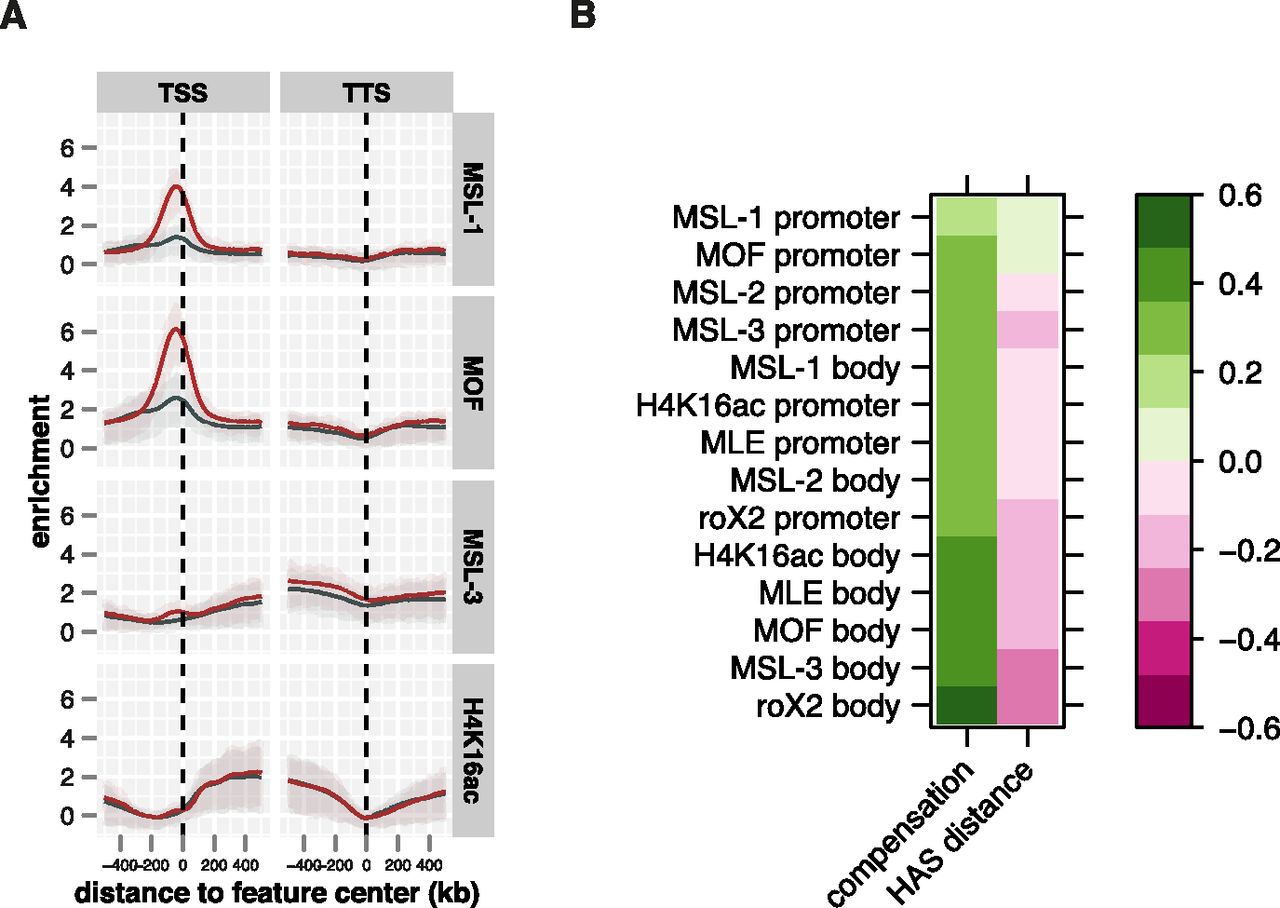
MSL feature enrichment on the transcribed regions correlate well with compensated gene expression. (A) Distribution of MSL-1, MOF, MSL-3, and H4K16ac on X-chromosomal active genes with (red, n = 361) or without (dark blue, n = 752) MSL-1 promoter peaks. Shaded areas above and below the solid lines describe the interquartile range of enrichment. Signals on HAS have been masked for this analysis. (B) Correlation matrix of MSL feature enrichments on promoter or body regions of active genes and functional compensation and distance of the genes from HAS. Pearson correlation coefficients are color-coded as indicated by the scale bar on the right. Signals deriving from HAS have been masked for this analysis.


