
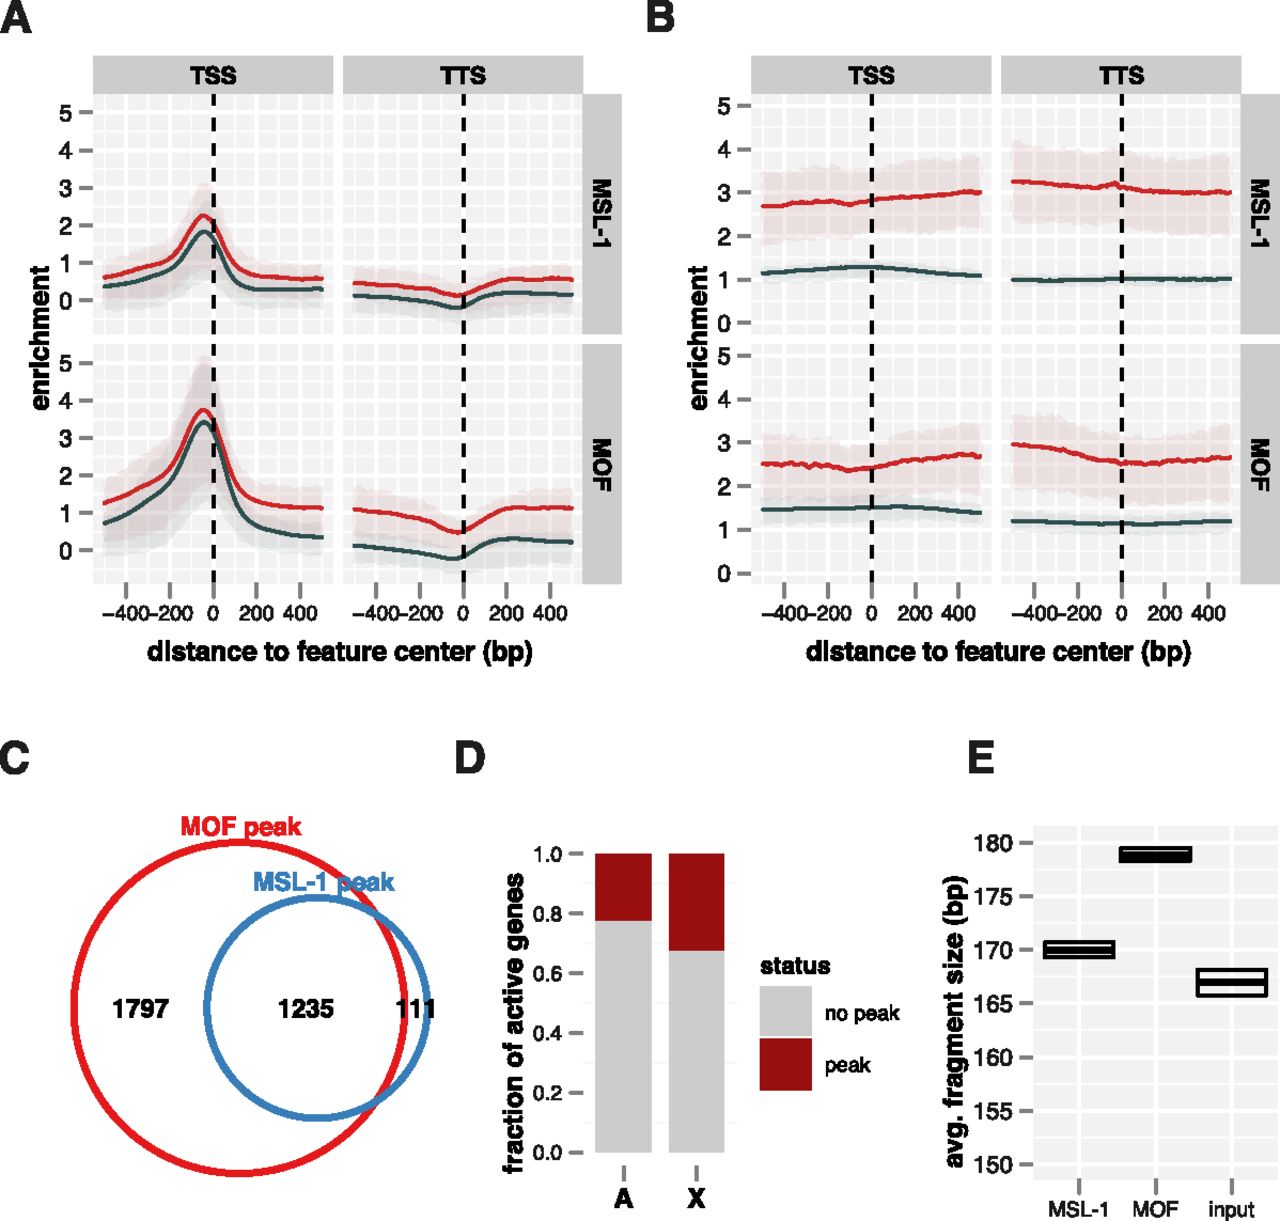
MSL-1 and MOF bind promoters of some active genes genome-wide. (A) Average ChIP-seq enrichment of MOF and MSL-1 along active genes on the X (red line, n = 1113) and the autosomes (dark blue line, n = 5341). Shaded areas on top and bottom of the solid lines describe the interquartile range of enrichment. Signals on HAS have been masked for this analysis. (B) Corresponding ChIP-chip enrichments. (C) Venn diagram depicting the overlap of MSL-1 and MOF peaks at promoters on both X and autosomes. Signals on HAS have been masked for this analysis. (D) Fractions of active genes that have an MSL-1 peak within the promoter. (E) Average DNA fragment sizes of input and precipitated samples in the center of MSL-1 promoter peaks as precisely determined by paired-end sequencing. Top and bottom edges of the box indicate the 95% confidence interval.


