
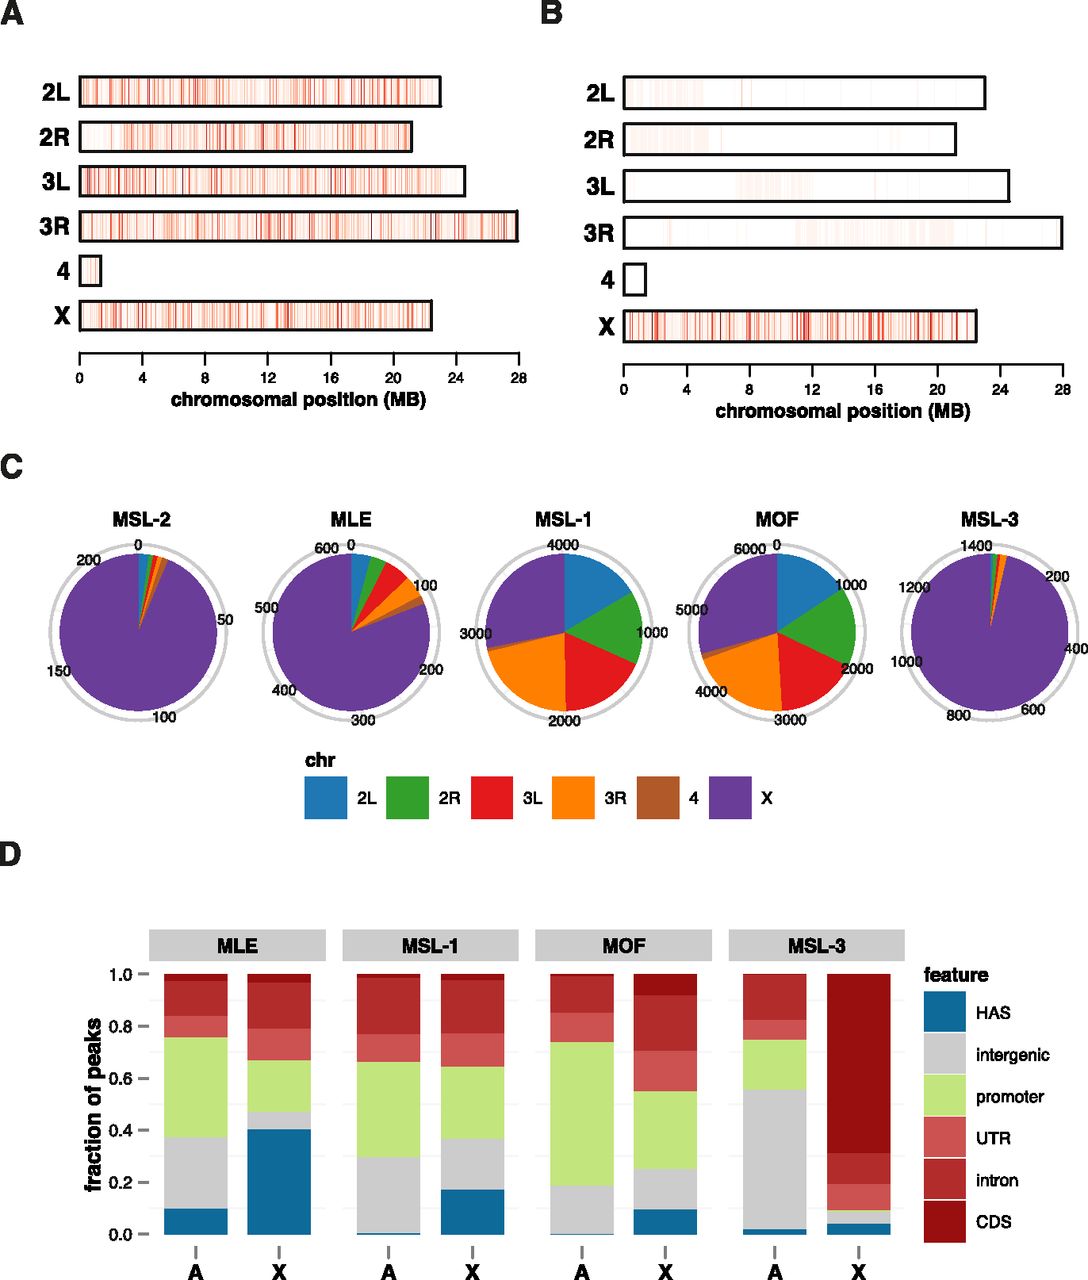
MSL-1 and MOF ChIP-seq profiles do not show an X-chromosomal enrichment. Chromosomal distribution of ChIP-seq (A) and ChIP-chip (B) enrichment signals for MOF. Each vertical line within a chromosome represents the maximum enrichment signal of a 20-kb window with a color scaling linearly from white (30% quantile) to dark red (99.9% quantile). For the sake of clarity, signals from heterochromatic arms have been omitted. (C) Chromosomal distribution of MSL-2, MLE, MSL-1, MOF, and MSL-3 peaks. Omitted are peaks mapping to the heterochromatic arms. (D) Fractional distribution of features bound on autosomes (A) versus the X chromosome (X) for the indicated dosage compensation proteins.


