
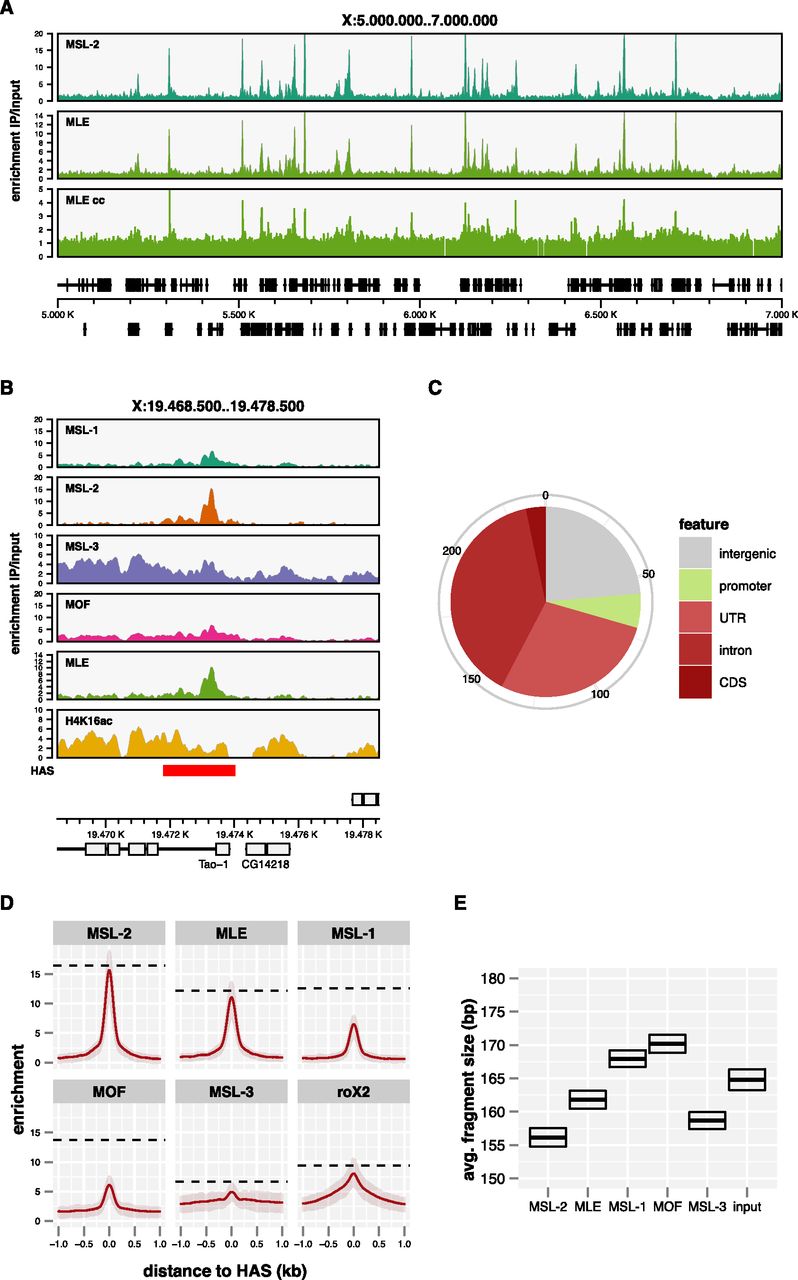
MLE binds with MSL-2 at high-affinity binding sites. (A) A representative 2 MB X-chromosomal region with ChIP-seq binding profiles for MSL-2 and MLE. In addition, a ChIP-chip profile for MLE (MLE cc) is shown. (B) MSL complex feature profiles at a known high-affinity binding site (HAS) in the last intron of the Tao-1 gene (Straub et al. 2008). (Red rectangle) The position and extent of the previous HAS definition. (C) Distribution of the newly defined 241 HAS on functional regions of the genome. (D) Average enrichment of MSL complex components along 2 kb surrounding the centers of all HAS (n = 241). Red-shaded areas behind the solid red line depict the interquartile range of enrichment. (Horizontal dashed lines) Median enrichment of the corresponding feature in its genome-wide top 200 peaks including HAS and non-HAS peaks. (E) Average DNA fragment sizes of input and precipitated samples in the center of all HAS as precisely determined by paired-end sequencing. Top and bottom edges of the box indicate the 95% confidence interval.


