
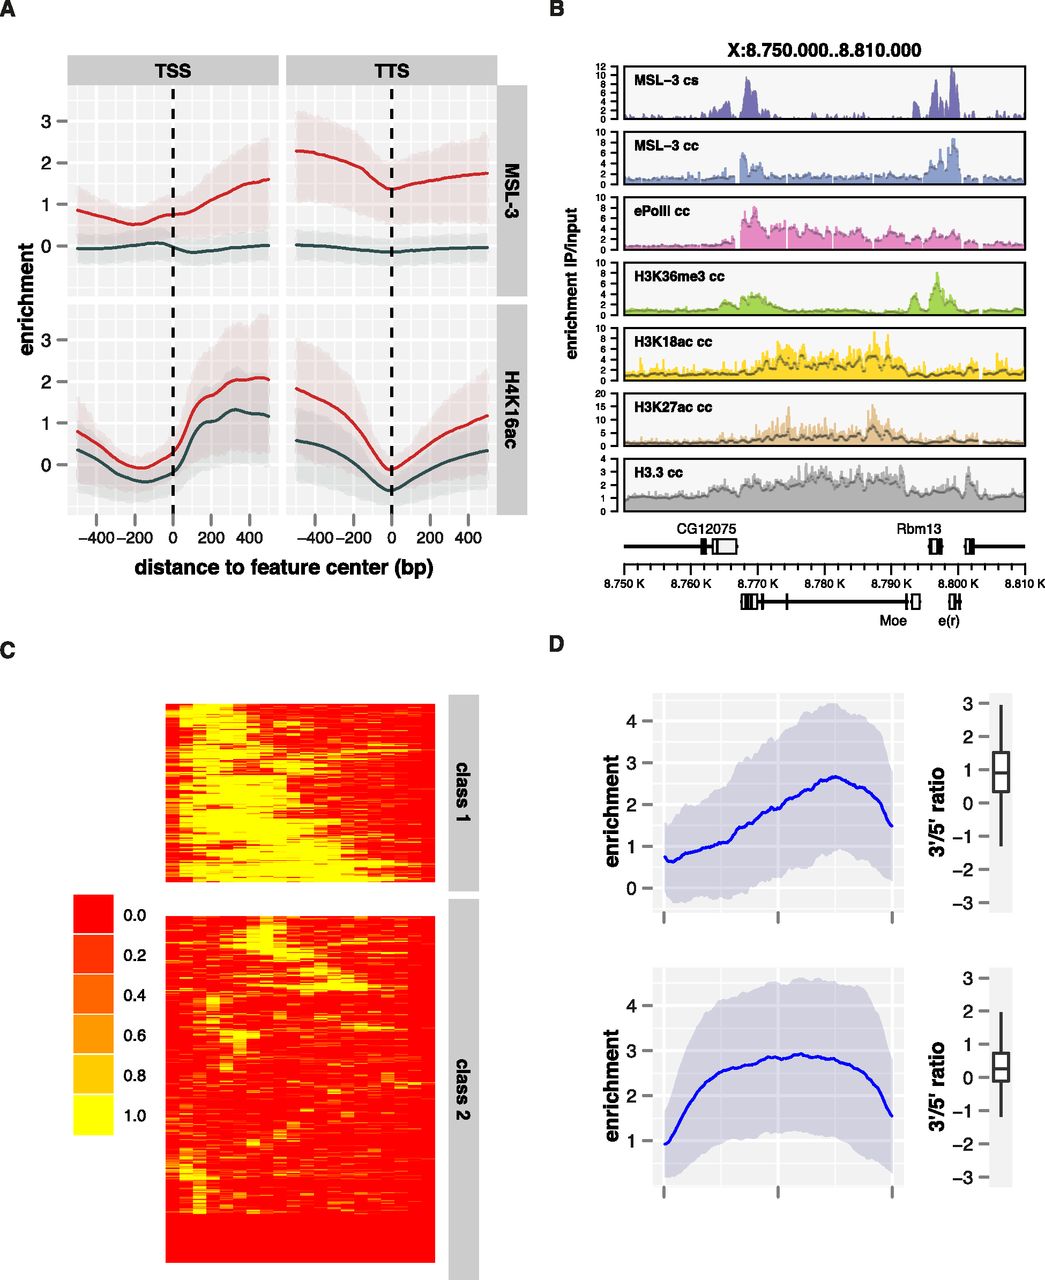
MSL-3 associates with active chromatin marked by H3K36me3. (A) Average ChIP-seq enrichment of MSL-3 and H4K16ac along active genes on the X (red line, n = 1113) and the autosomes (dark blue line, n = 5341). Shaded areas above and below the solid lines describe the interquartile range of enrichment. (B) Chromatin features around a representative locus comprising a gene with a long intron. ChIP-seq (cs) and ChIP-chip (cc) derived maps for MSL-3 and selected ChIP-chip profiles derived from the modEncode project are shown. (C) Clustering of Drosophila genes based on their exon structure (active, non-nested, X-linked genes >1000 bp and <10000 bp in length, n = 592). The color scale indicates the intron density within a sampling bin. (D) Average MSL-3 ChIP-seq profiles on genes with (n = 201, top) and without (n = 391, bottom) large 3′ introns. Genes were scaled for length. Boxplots on the right show the distribution of the ratios of 3′ half to 5′ half of the signals. Signals on HAS have been masked for this analysis.


