
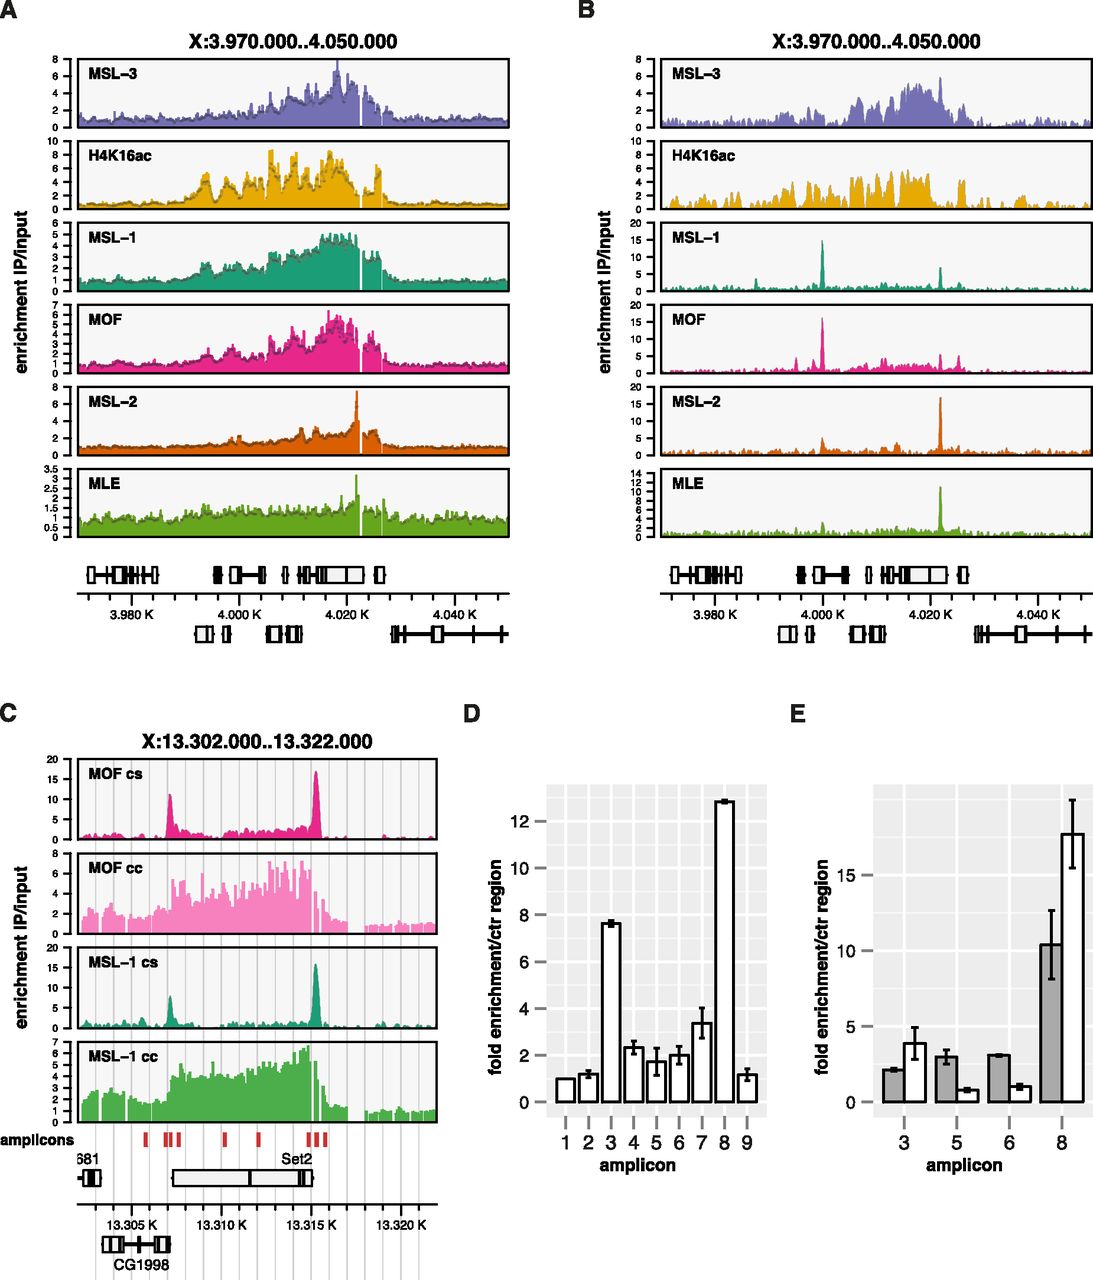
Systematic mapping of MSL proteins by ChIP-seq reveals novel binding qualities at high resolution. (A) ChIP-chip coverage profiles of MSL complex features on a representative X-chromosomal locus. (B) Corresponding ChIP-seq profiles. Genes above the x-scale are transcribed from left to right, genes below are transcribed from right to left. Exons are shown as boxes, introns as lines. The y-scale reflects the continuous unsmoothed average signal enrichment of the IP over the input samples. The x-scale reflects the chromosomal position in kilobases. (C) MOF and MSL-1 ChIP enrichment on the X-chromosomal Set2 locus as determined by ChIP-seq (cs) and ChIP-chip (cc). (D) qPCR quantitation of MOF enrichment using amplicons tiled along the Set2 locus. Chromatin was sheared to ∼180 bp using the Covaris S220 prior to IP. Amplicons correspond to the red boxes indicated in panel C ordered from left to right with the first serving as control (unbound) locus. Error bars reflect the standard error of the mean (SEM) of three independent biological replicates. (E) qPCR quantitation on a subset of amplicons comparing MSL-1-ChIP performed on weakly (800 bp, gray bars) and strongly (180 bp, white bars) sheared chromatin. Error bars reflect the standard error of the mean (SEM) of two independent biological replicates.


