
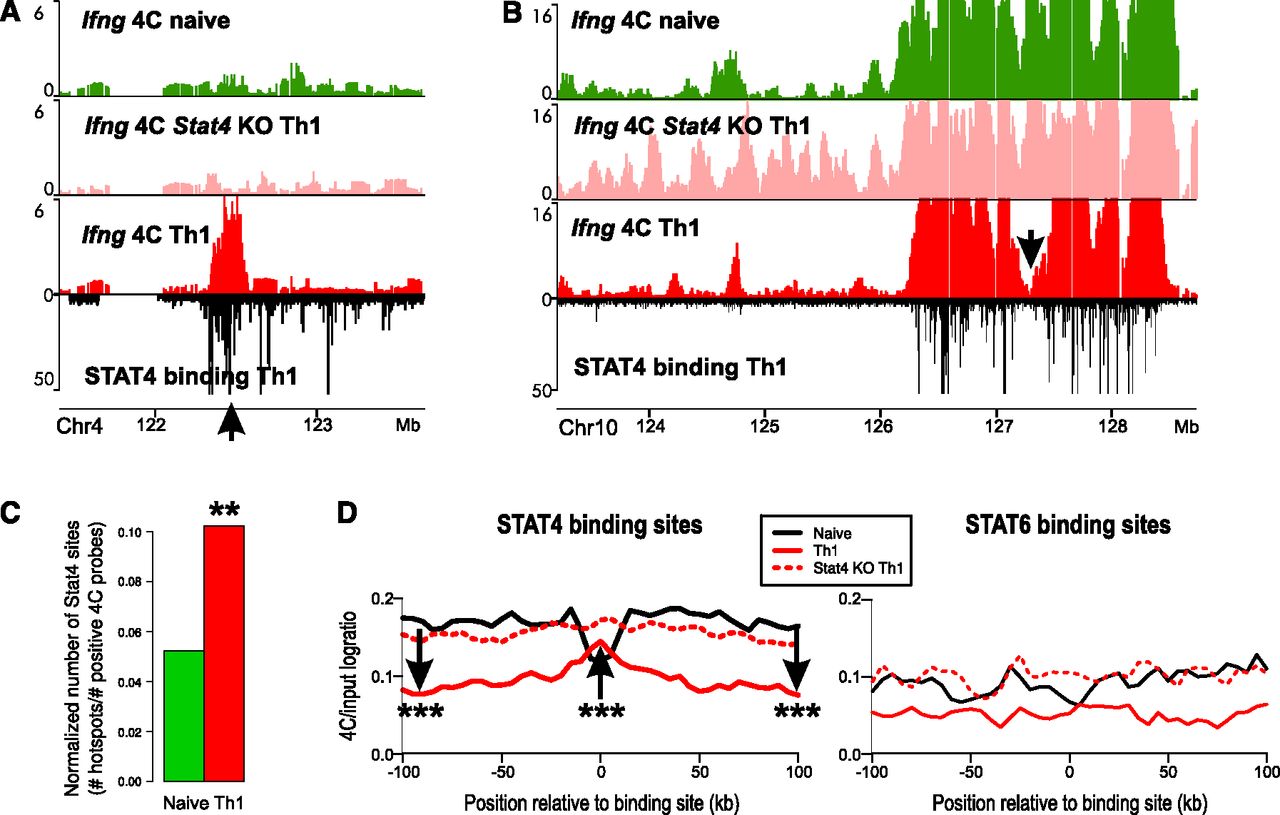
Th1-specific contacts are selected and strengthened at STAT4 binding sites. (A,B) Examples of STAT4 binding (black track) at Ifng contacts in naive (green), Stat4 KO (pink), and Th1 (red) cells in trans (A) and cis (B). (C) The Ifng contact loci have the highest enrichment of STAT4 binding sites in Th1 cells. The plot shows the numbers of Th1-derived STAT4 ChIP-seq sites per positive 4C probe for each 4C data. (**) P-value < 0.01 (permutation test, see Methods). (D) The average profile of Ifng 4C for each cell type centered at STAT4 binding sites. (***) The arrow represents a significant change (t-test P-value < 0.005). The average profile of Ifng 4C for each cell type centered at STAT6 binding sites (in Th2).


