
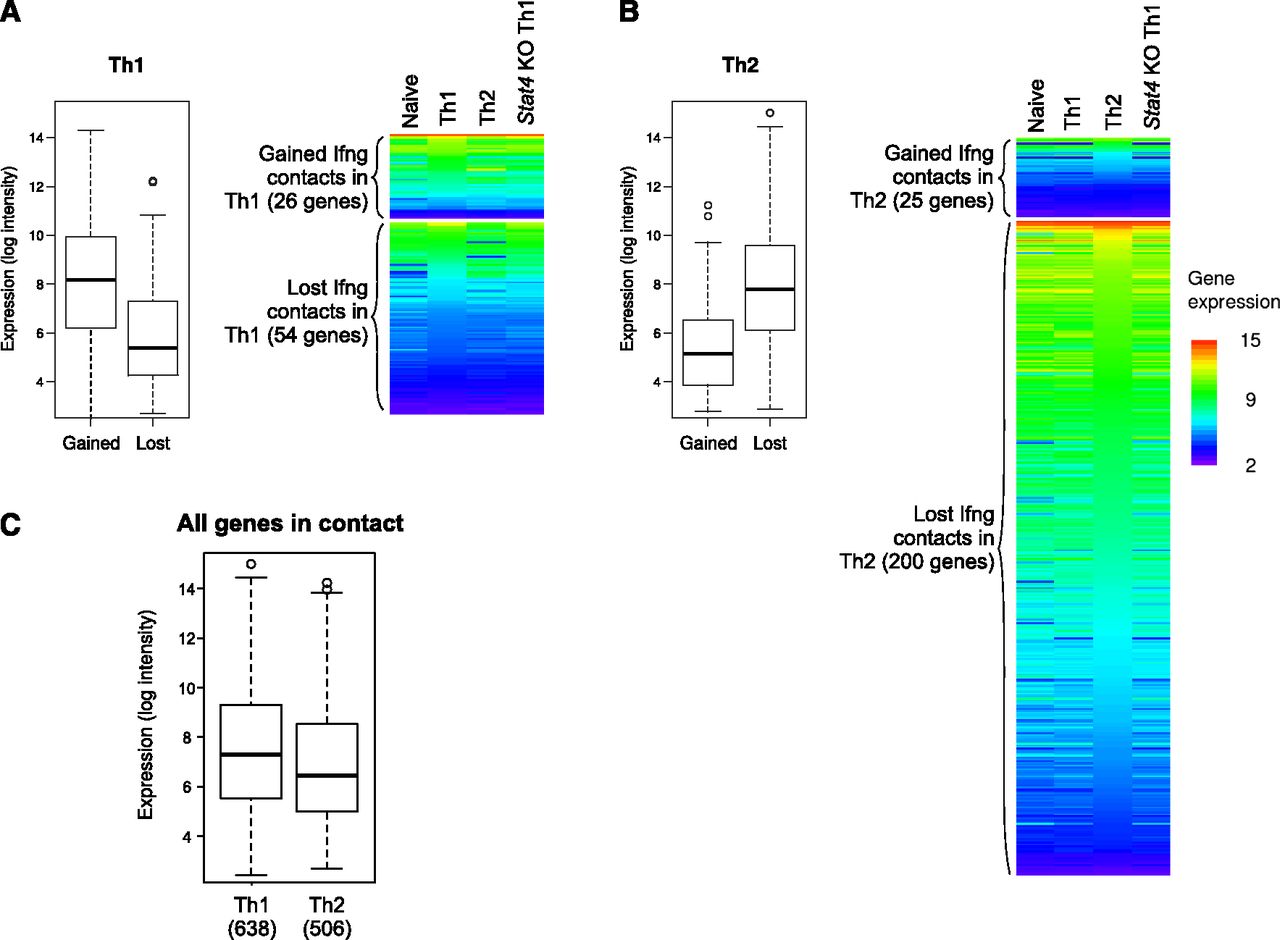
The divergent Ifng contact landscapes in Th1 versus Th2 do not differ significantly in overall transcriptional activity. (A) The expression of the genes on regions that specifically change Ifng interactions was examined in all cell types (see Methods). During Th1 differentiation, Ifng is transcriptionally activated and increases interactions with a set of genes that are robustly expressed in all CD4+ T cells. On the other hand, the loci that lose contact harbor genes whose transcript levels are low throughout. (B) In Th2 cells, the transcriptionally silent Ifng gains numerous interactions with silenced or repressed genes, while losing contact with some highly expressed genes. Box plots show the expression values from the corresponding lineage, Th1 (A) and Th2 (B). The heatmaps include expression data from the other cell types, and are sorted by the expression values in Th1 (A) and Th2 (B) within each category of genes. (C) The expression of all the genes in contact with Ifng in Th1 and Th2 are nonetheless similar. The number in parenthesis indicates the total number of genes in each set.


