
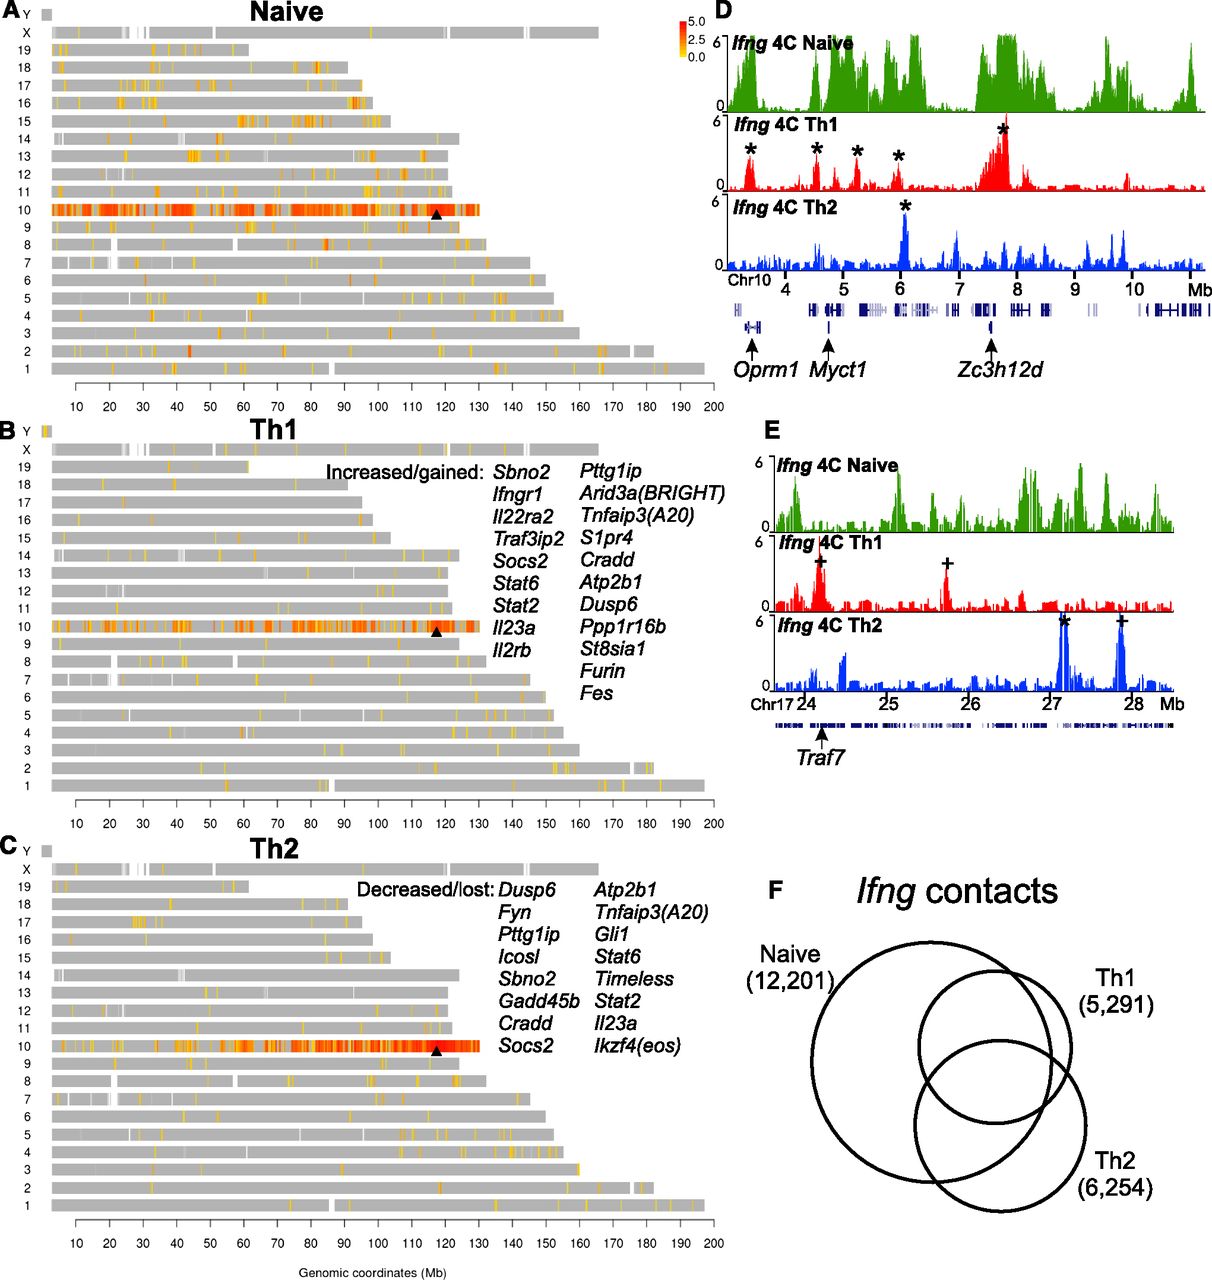
Lineage-specific reorganization of the Ifng interactome. The genomic map of Ifng contacts in the naive (A), Th1 (B), and Th2 (C) lymphocytes shows the locations of positive 4C probes (P-score > 4; see Methods) marked in a color scale with red corresponding to high contact frequency (log2 ratio of 4C/input DNA). (Gray) Locations of all other probes. (Arrowhead) Location of Ifng. The genes that reside in dramatically gained contact loci in Th1 (B) or lost contact loci in Th2 (C) are listed. (D,E) Examples show selection from pre-existing contacts in naive cells as well as emergence of de novo contacts in the differentiated cells. (*) Retained contacts; (+) gained contacts. (F) The Ifng contact regions that are detected from each cell type. The Venn diagram areas are drawn in proportion to the numbers of probes in each category of overlaps.


