
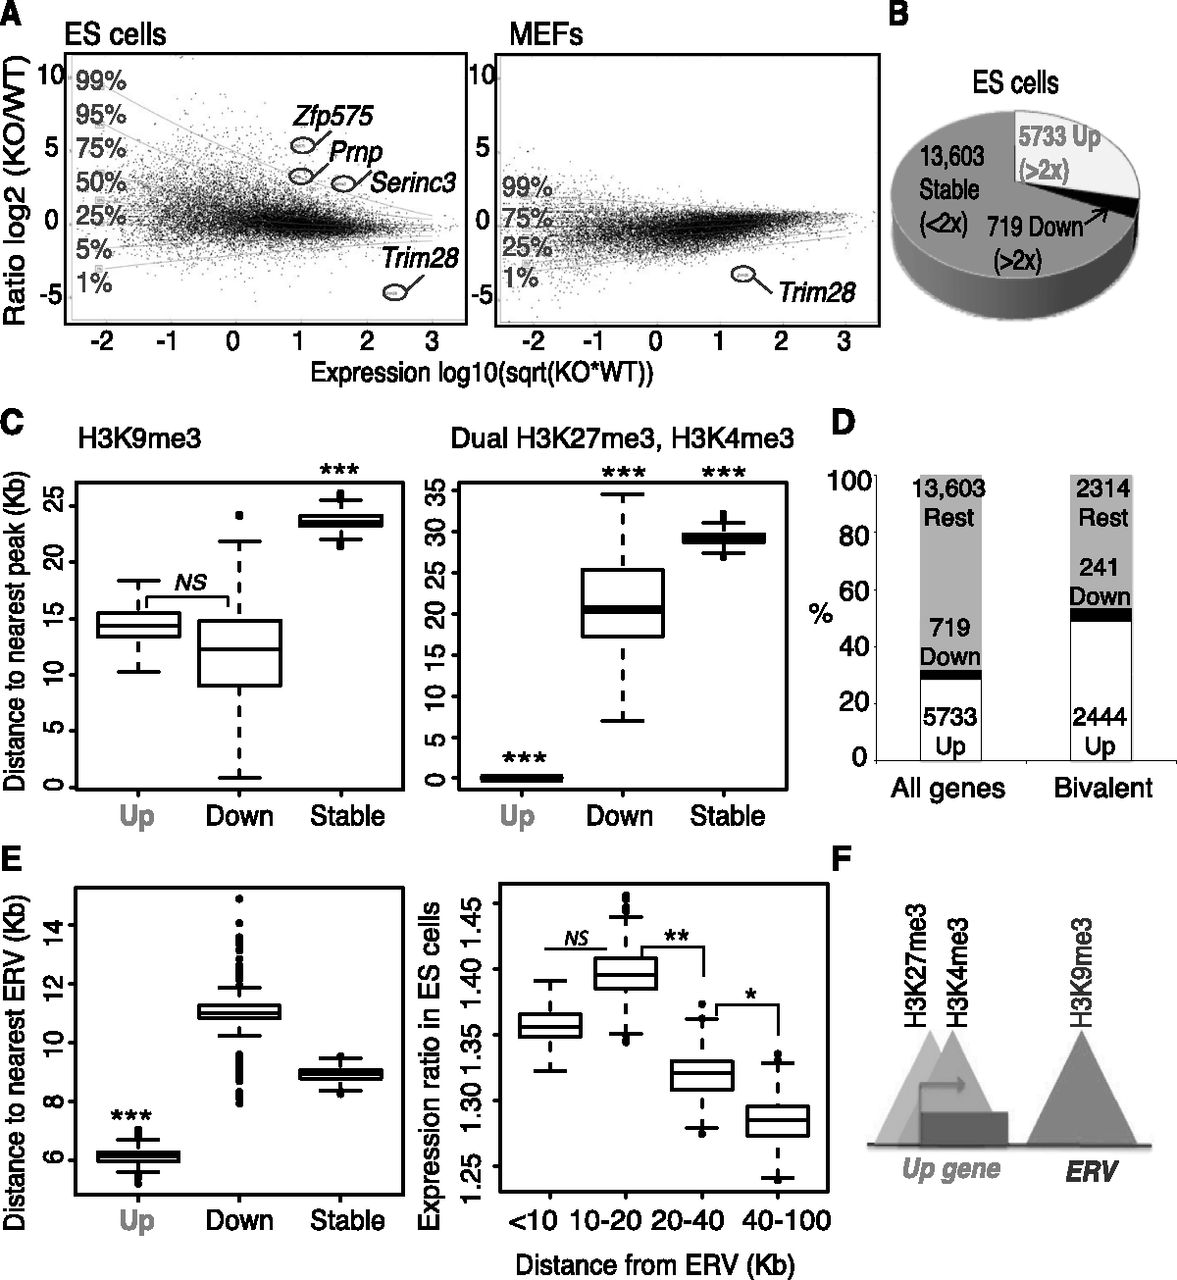
Trim28 deletion in ES cells leads to up-regulation of genes close to ERVs, including many bivalent genes. (A) mRNA-seq in Trim28 wild-type (WT) and knock-out (KO) embryonic stem (ES) cells (left panel) or Trim28 WT and KO MEFs (right panel). Transcripts (assembly mm9) are plotted in black with the ratio on the y-axis and expression level on the x-axis. (Sqrt) Square root. (Horizontal lines) Levels of gene deregulation (e.g., only 1% of genes lie above the 99% line). The genes Zfp575, Prnp, and Serinc3 (referred to later) are highlighted, as well as Trim28. (B) Data from ES cells in A were used to group transcripts depending on whether they were greater than twofold up-regulated (Up), greater than twofold down-regulated (Down), or less than twofold affected (Stable). Up and Down genes were significantly changed based on a DESeq test (Anders and Huber 2010) (adjusted P-values ≤0.05). (C) The distance to the nearest peak (of either H3K9me3 on the left panel, 19,128 peaks, or dual H3K27me3, H3K4me3 peaks on the right panel, 12,390 peaks) from Up, Down, and Stable gene groups. (Left P-values) Up versus Down, not significant (NS), P = 0.48; Up versus Stable, P = 7.7 × 10⁻¹⁰; Down versus Stable, P = 0.0010. (Right P-values) Up versus Down, P = 9.9 × 10⁻¹¹; Up versus Stable, P ≤ 2.2 × 10⁻¹⁶; Down versus Stable, P = 4.1 × 10⁻⁴. (D) Bivalent genes (as defined above by the presence of dual H3K27me3, H3K4me3 peaks) are enriched for up-regulated genes compared with all genes. (E) ERV locations (N = 82,382) were downloaded from the UCSC Genome Browser to include the categories ERV, ERV1, ERVK, and ERVL as defined by Repbase with a size cutoff of 500-bp minimum and used to plot the distance to the nearest ERV from Up, Down, and Stable gene groups (left). A Mann-Whitney Wilcoxon test was used to calculate significance: Up genes were significantly closer than the other two gene groups; (***) P ≤ 0.001. (Right) All genes were divided into groups based on their distance to the nearest ERV and their ratio between Trim28 WT and KO ES cells plotted on the y-axis. (P-values) The groups 10–20 versus 20–40 and 20–40 versus 40–100 are different: P = 0.0048 and P = 0.01, respectively. (F) Model showing that Up genes are close to H3K9me3 marks and ERVs and are often bivalent.


