
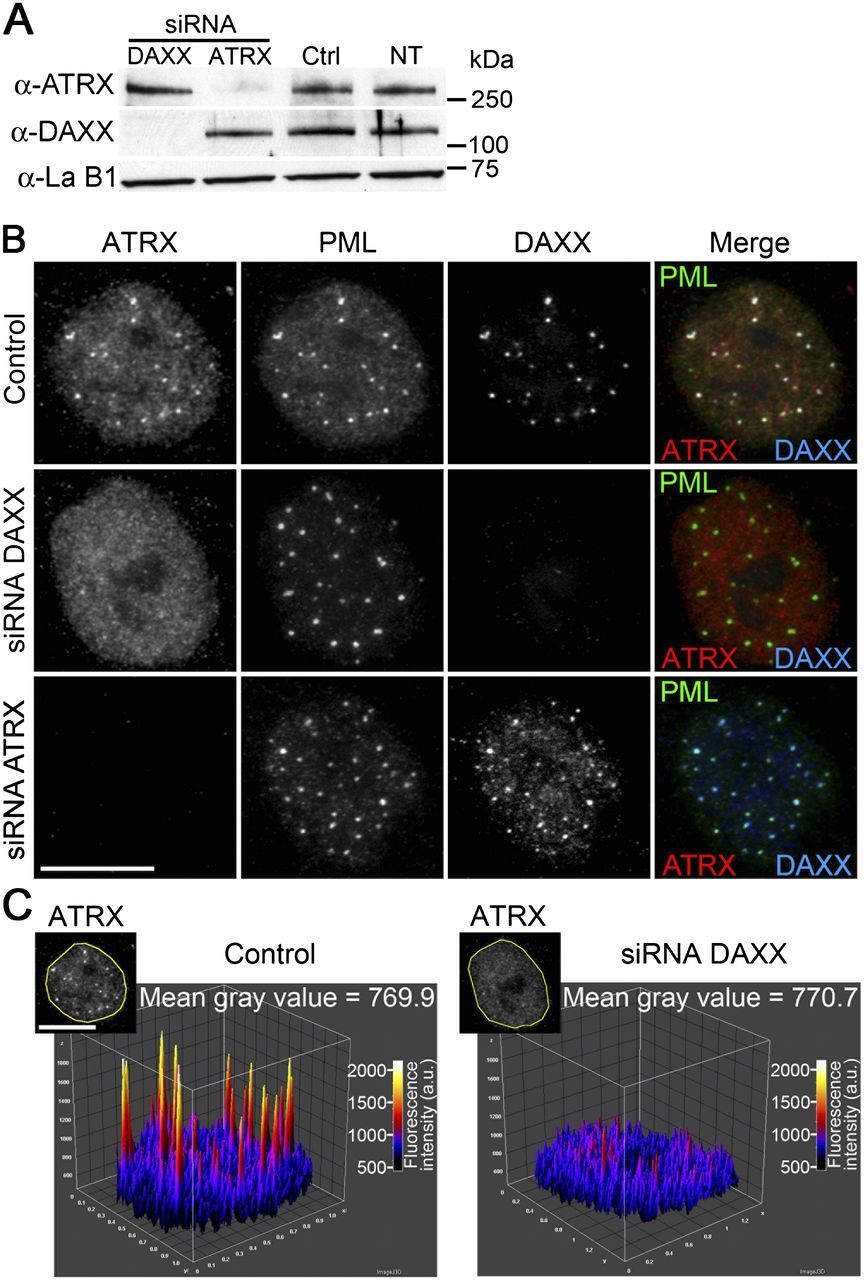
DAXX down-regulation delocalizes ATRX from PML bodies. (A) Western blot analysis of siRNA-mediated ATRX and DAXX down-regulation. Lamin B1 is shown as loading control. (Ctrl) Control sham depletion with H2O; (NT) nontransfected cells. (B) Immunolocalization of ATRX, PML, and DAXX in sham-depleted (top), DAXX-depleted (middle), and ATRX-depleted (bottom) cells. (C) Distribution of ATRX in a sham (control)– and DAXX-depleted cell (shown in inset, corresponding to ATRX pictures in panel A). ATRX-associated fluorescence intensity of each pixel delimited by the yellow line in insets is plotted in a three-dimensional graph. The similarity of the mean gray values in both cell types shows that relocalization of ATRX in DAXX-depleted cells is not due to a lower amount of fluorescence signal. Scale bars, 15 μm.


