
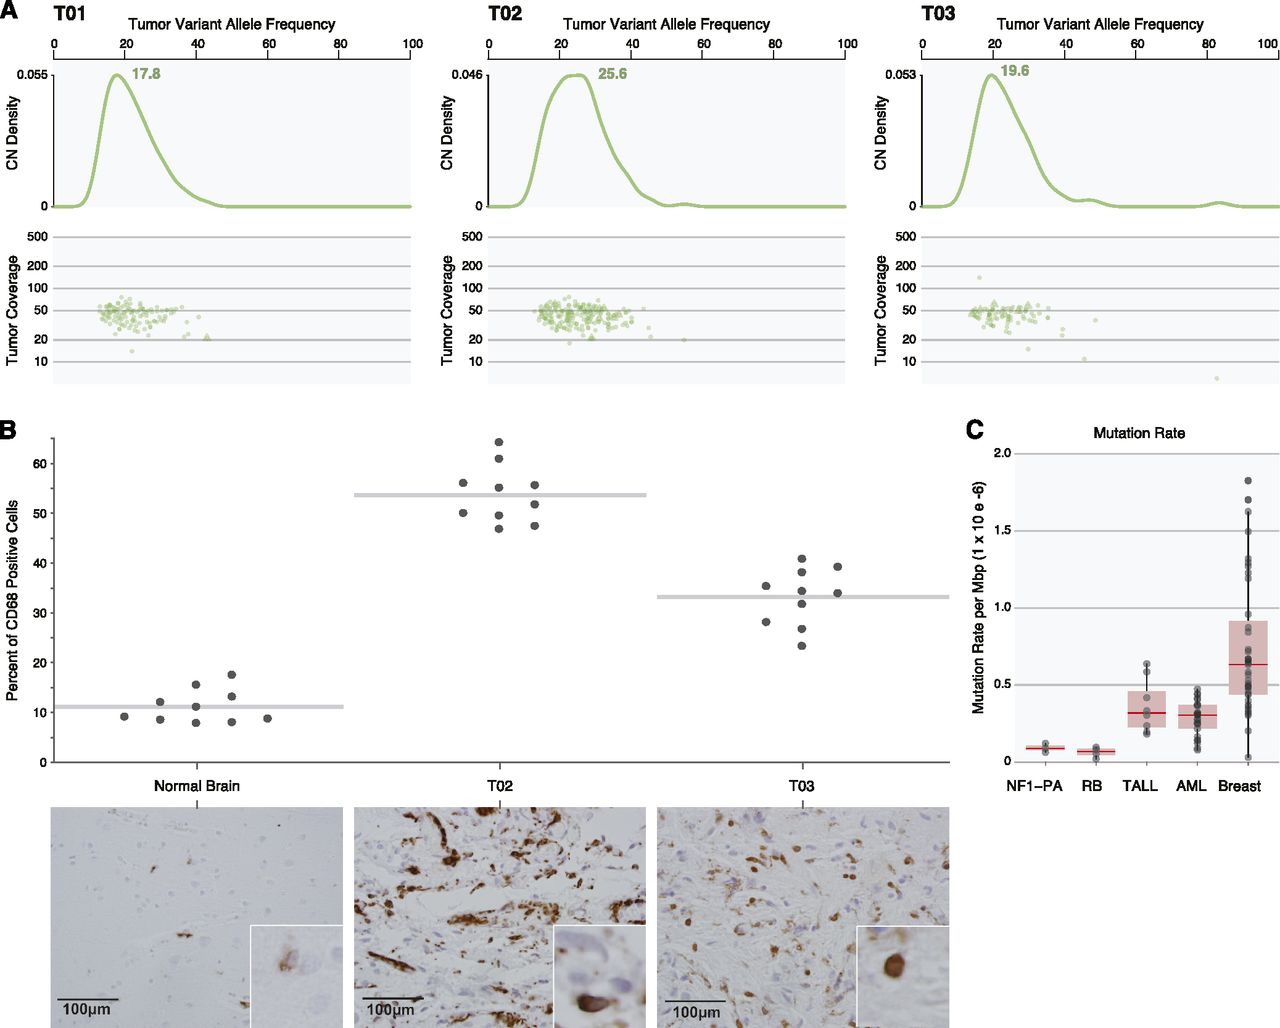
NF1-PA tumor clonality, cellular heterogeneity, and mutation rate. (A) Somatic mutation clusters were defined based on allele-specific supporting read counts in whole-genome data for mutations identified in nonrepetitive genomic with diploid copy number. Kernel density estimation indicates a monoclonal origin for each tumor and reveals a substantial proportion of stromal cells in the tumor biopsy with estimated tumor purities of 35%, 51%, and 39% for T01, T02, and T03, respectively. (B) CD68 immunostaining confirms the marked cellular heterogeneity of NF1-PA tumors, with 35%–55% of the cells in these tumors representing microglia/macrophages. Representative photomicrographs are included for each NF1-PA tumor. Scale bar, 100 μm. Magnification, 400×. Insets, 600×. (C) BMRs are based on the total sum of somatic mutations identified in all nonrepetitive genomic regions from WGS of three NF1-PA tumors, and compared with pediatric retinoblastoma (N = 4) (Zhang et al. 2012a), pediatric TALL (N = 8) (Zhang et al. 2012b), the M1 and M3 subtypes of adult AML (N = 25) (Welch et al. 2012), and luminal breast cancer (N = 46).


