
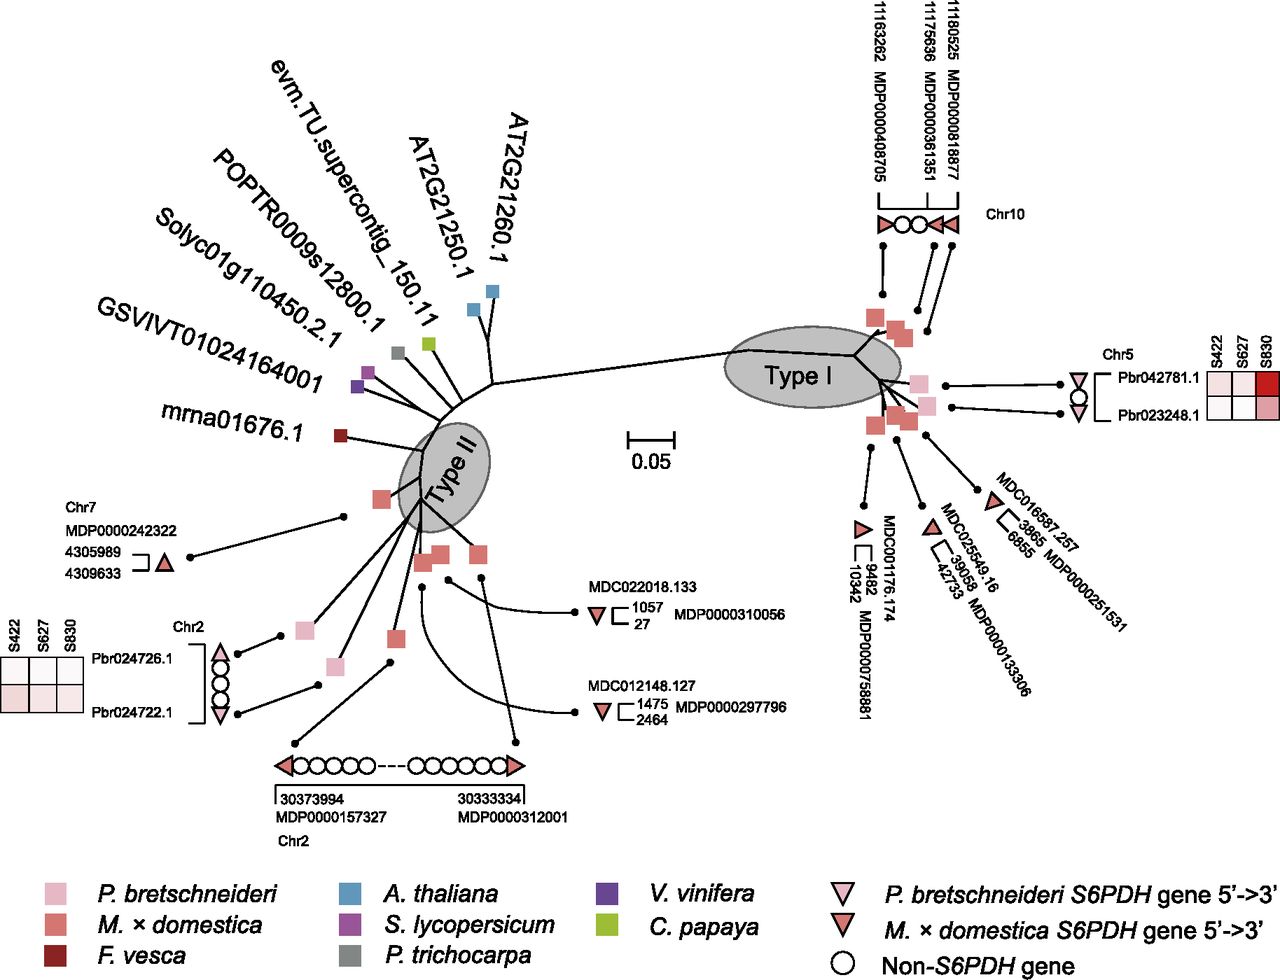
Figure 7.
Phylogenetic relationships, distribution patterns, and transcriptional expression of S6PDH genes. The phylogenetic tree was constructed using the maximum likelihood method with Mega 5.0 software (Tamura et al. 2011). Heatmaps of expression patterns were drawn using Cluster 3.0 (de Hoon et al. 2004) along with expression levels (fragments per kilobase per million mapped reads [FPKM]) of each of the S6PDH genes. Different colors have been used for different species. S422, S627, and S830 are three different stages of development. Dotted lines between circles correspond to deleted non-S6PDH genes.


