
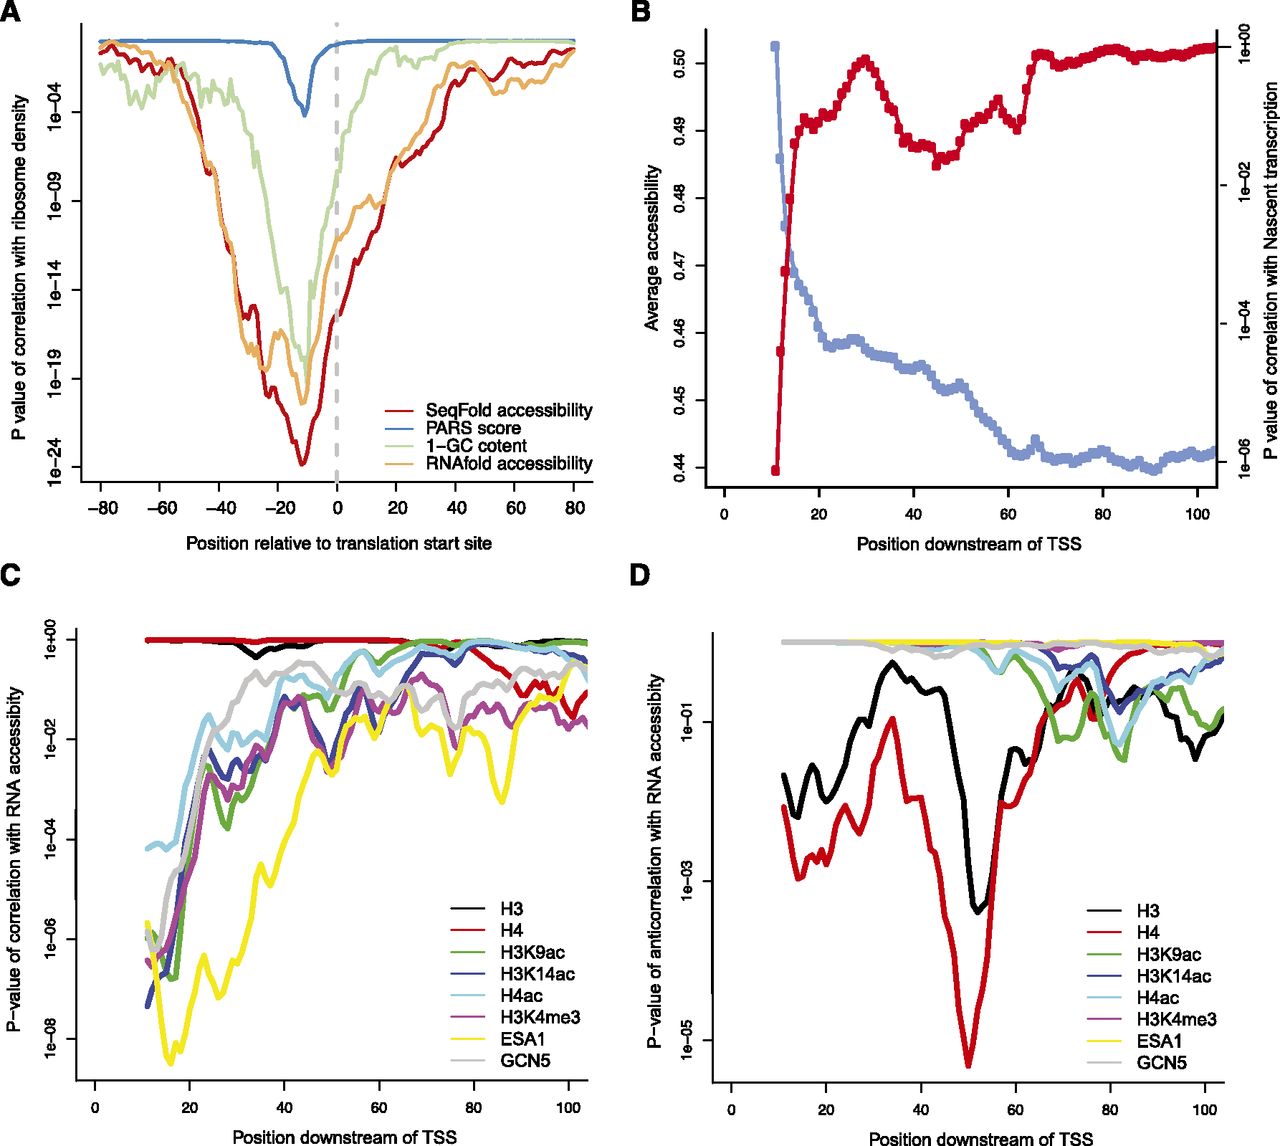
Implications of SeqFold-derived RNA accessibility on translation efficiency and transcription initiation. (A) RNA accessibility around the translation start site positively correlates with ribosome density, a proxy of translation efficiency (Ingolia et al. 2009). Shown are the P-values of the Spearman correlation between average accessibility in a 30-bp-wide window and the ribosome density. Also shown are the relationship of ribosome density with the raw PARS signal (Kertesz et al. 2010), RNA accessibility calculated directly from RNAfold without experimental information, and GC content of the sequences. (B) The average accessibility increases near the 5′ end of a transcript and positively correlates with Pol II density, a proxy of nascent transcription (Churchman and Weissman 2011). Shown are the average accessibilities in a 20-bp-wide window sliding from the TSS (blue) and the P-values of the Spearman correlation with the average Pol II density calculated from the [40, 100] region (red). (C) The 5′ end accessibility of a transcript positively correlates with histone modifiers and chromatin remodeling enzymes (Pokholok et al. 2005) but not nucleosome occupancy (Pokholok et al. 2005). Shown are the P-values of the Spearman correlations between the average accessibility in a 20-bp-wide window sliding downstream of TSS and various histone marks. (D) The 5′ end accessibility of a transcript negatively correlates with nucleosome occupancy at ∼50 bp downstream of TSS. Shown are the P-value of the anticorrelations between the average accessibility in a 20-bp-wide window sliding downstream of TSS and various histone marks. The data points are the centers of the windows.


