
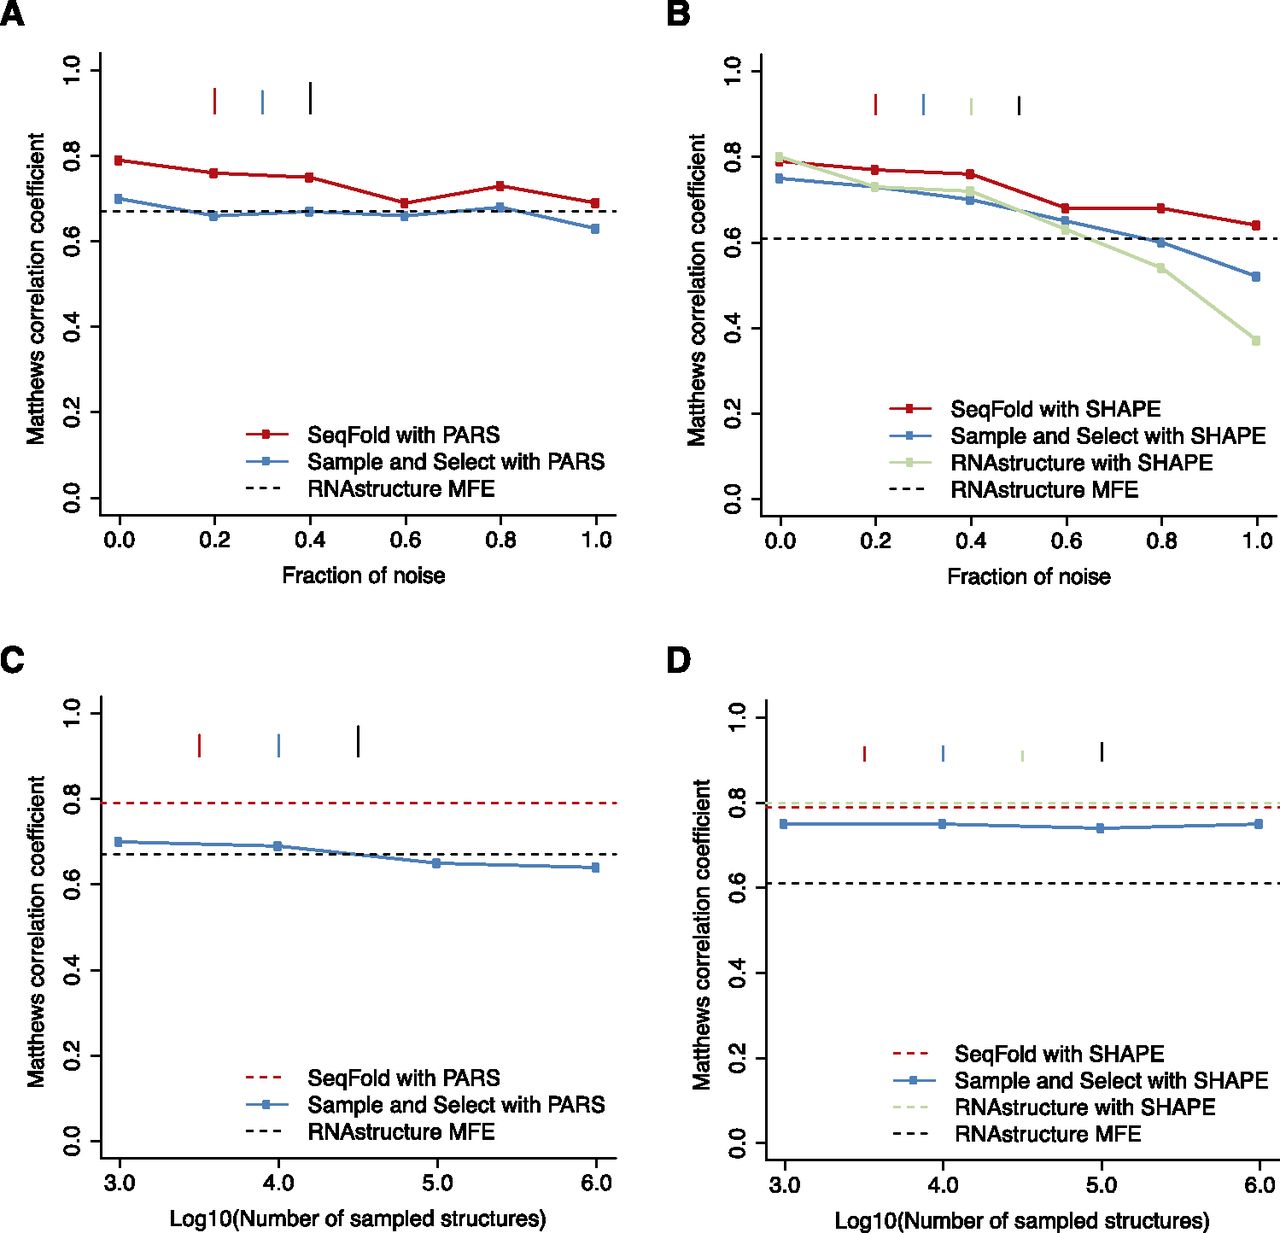
Comparison of the robustness of RNA secondary structure prediction methods on PARS and SHAPE data. (A) The mean prediction accuracy measured by Matthews correlation coefficient (MCC) for RNAstructure MFE, “sample and select,” and SeqFold with increasing fractions of PARS data being replaced by randomized signals. (B) The mean MCC for RNAstructure MFE, RNAstructure pseudo-energy, “sample and select,” and SeqFold with increasing fractions of SHAPE data being replaced by randomized signals. (C) The mean MCC of the “sample and select” predictions for PARS data by sampling structures in the order of 1000, 10,000, 100,000, and 1,000,000. (D) The mean MCC of the “sample and select” predictions for SHAPE data by sampling structures in the order of 1000, 10,000, 100,000, and 1,000,000. The bars in each plot indicate the standard error of the mean MCC.


