
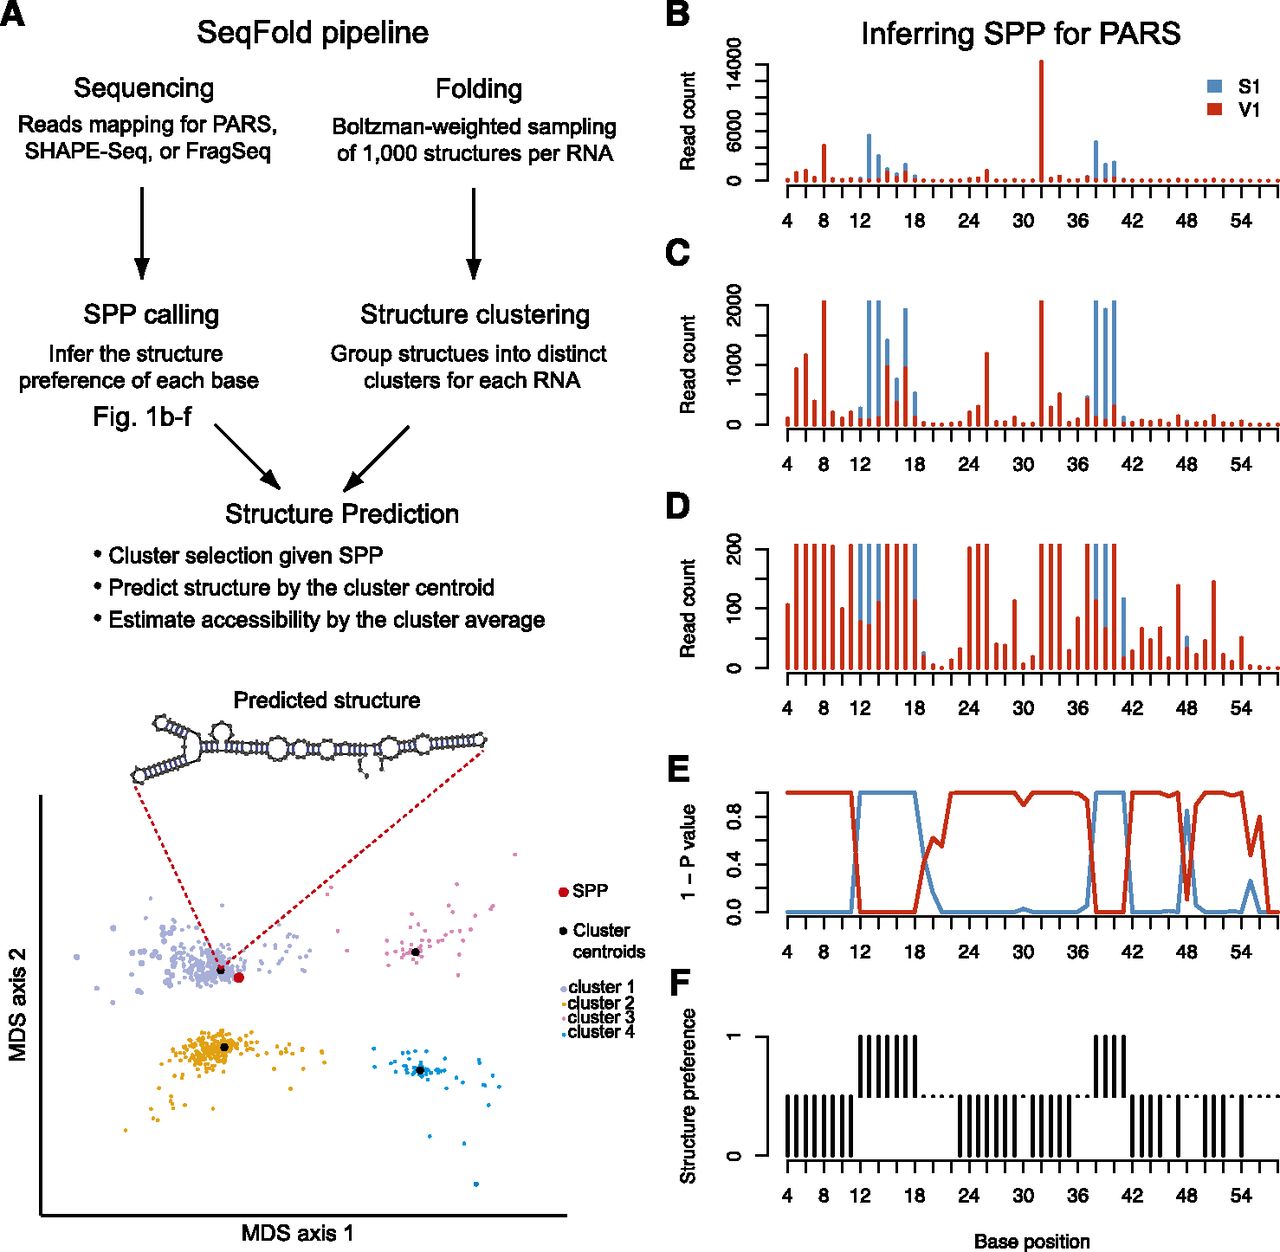
Framework of the SeqFold method. (A) The flowchart of integrated prediction of RNA secondary structure. On one hand, sequencing reads that contain RNA structure information are mapped, followed by the inference of structure preference for each base. The structure preferences of all informative bases of a transcript define the structure preference profile (SPP). On the other hand, 1000 structures per transcript are generated from the Sfold Boltzman sampling procedure and grouped into distinct clusters (Ding and Lawrence 2003; Ding et al. 2005, 2006). At the structure prediction stage, nearest neighbor classification is used to identify a specific structure cluster given an SPP. The centroid of the selected cluster is taken as the predicted structure and the average of the sample structures in the cluster gives the accessibility of each base. The bottom panel demonstrates the clustering pattern in the multidimensional scaling surface. (B–F) Illustration of the SPP calling process for PARS. (B) The read counts of RNase S1 and V1 along the P9-9.2 domain of the Tetrahymena ribozyme (Guo et al. 2004). C as B showing a maximal read count of 2000. D as B showing a maximal read count of 200. (E) The (1 - P-value) profile of hypergeometric test for each base. (F) Structure preference calls with FDR 0.05.


