
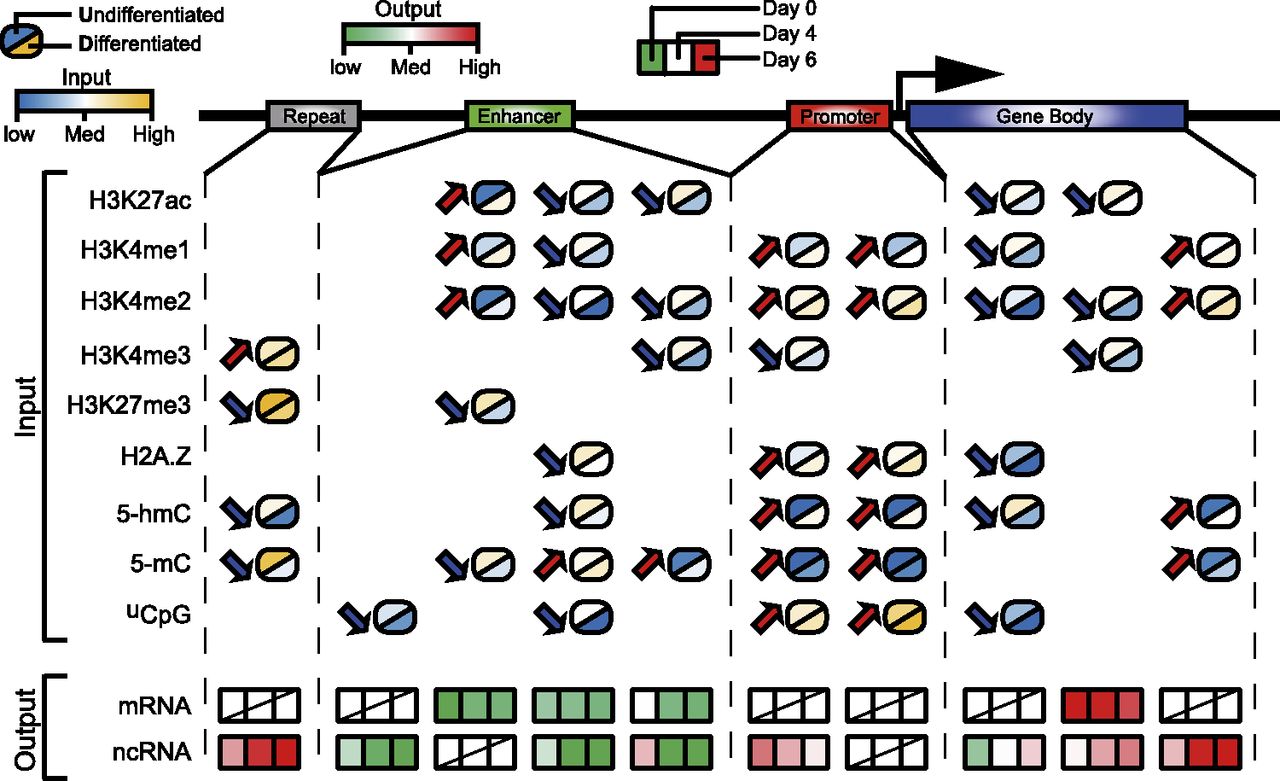
Figure 6.
A model for combinatorial epigenomic changes and gene expression. One to several combinatorial patterns (columns) were identified on each genomic feature. The model-learned intensity levels for each epigenomic mark (input rows) in the undifferentiated state and the differentiated state are color-coded, and the directions of change are marked by arrows. The corresponding temporal changes of mRNA and ncRNA expression are color-coded in a green-to-red scale (output rows).


