
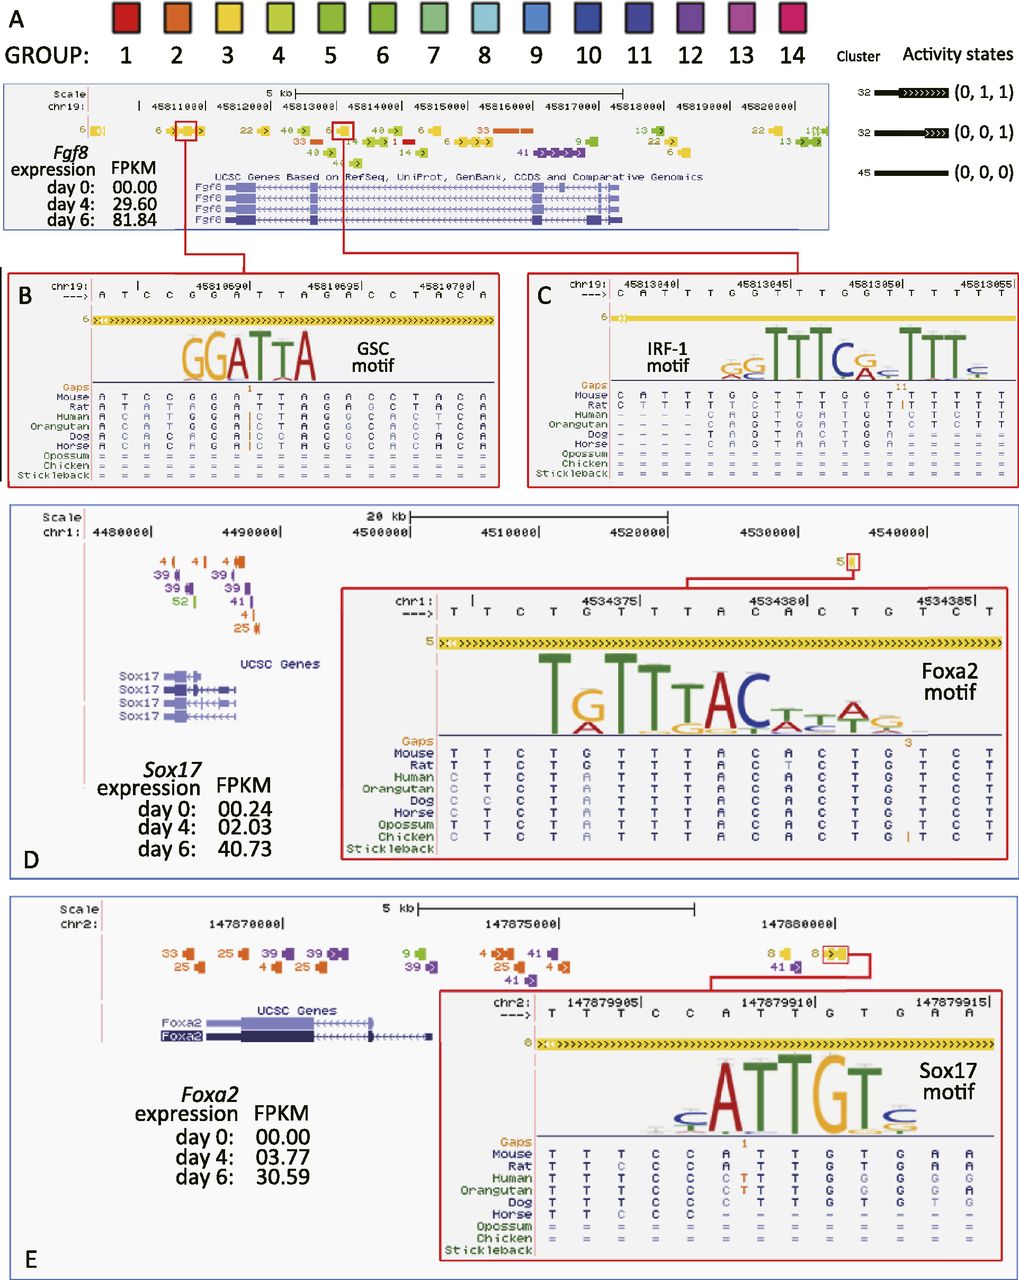
Predicted mesendoderm enhancers harbor transcription factor binding sites. Epigenomic clusters near the Fgf8 (A), Sox17 (D), and Foxa2 (E) genes. Genomic segments (colored bars) are marked by their cluster numbers on the left. Their variable widths indicate their activity states. A left-thin-right-fat bar indicates a change of the activity states. A strong GSC motif (B) and a strong IRF-1 motif (C) appeared in predicted enhancer segments in the 3′ and the intron of the Fgf8 gene. Both predicted enhancers showed changes of activities during the differentiation (left-thin-right-fat). A strong Foxa2 motif appeared in a predicted enhancer 50,000 bp upstream of the Sox17 gene (D). In turn, a strong Sox17 motif appeared in a predicted Foxa2 enhancer. (FPKM) Fragments per kilobase of exon per million fragments mapped.


