
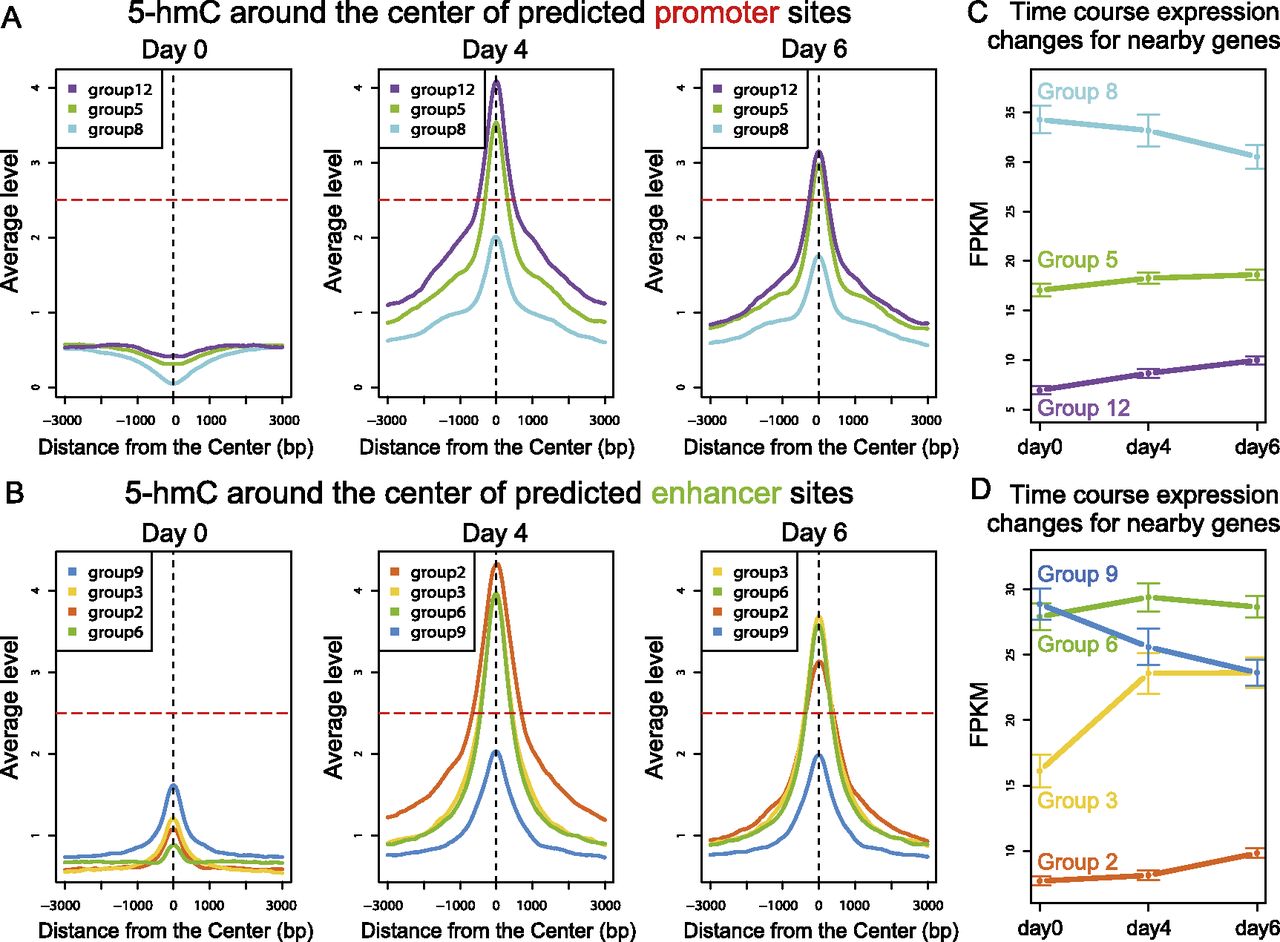
Figure 4.
A unified model showing the effects of 5-hmC on gene expression. (A–B) The average intensities of 5-hmC on predicted promoter groups (A) and enhancer groups (B) in three time points. Three thousand base pairs (bp) of flanking regions centered on the centers of the genomic segments of each group are shown. (C,D) The expression levels of nearby genes for predicted promoter groups (C) and enhancer groups (D). Mean and standard deviation (error bar) are shown for each time point. Whether 5-hmC increases above a critical threshold (horizontal line, A,B) correlates with the direction of expression changes. (FPKM) Fragments per kilobase of exon per million fragments mapped.


