
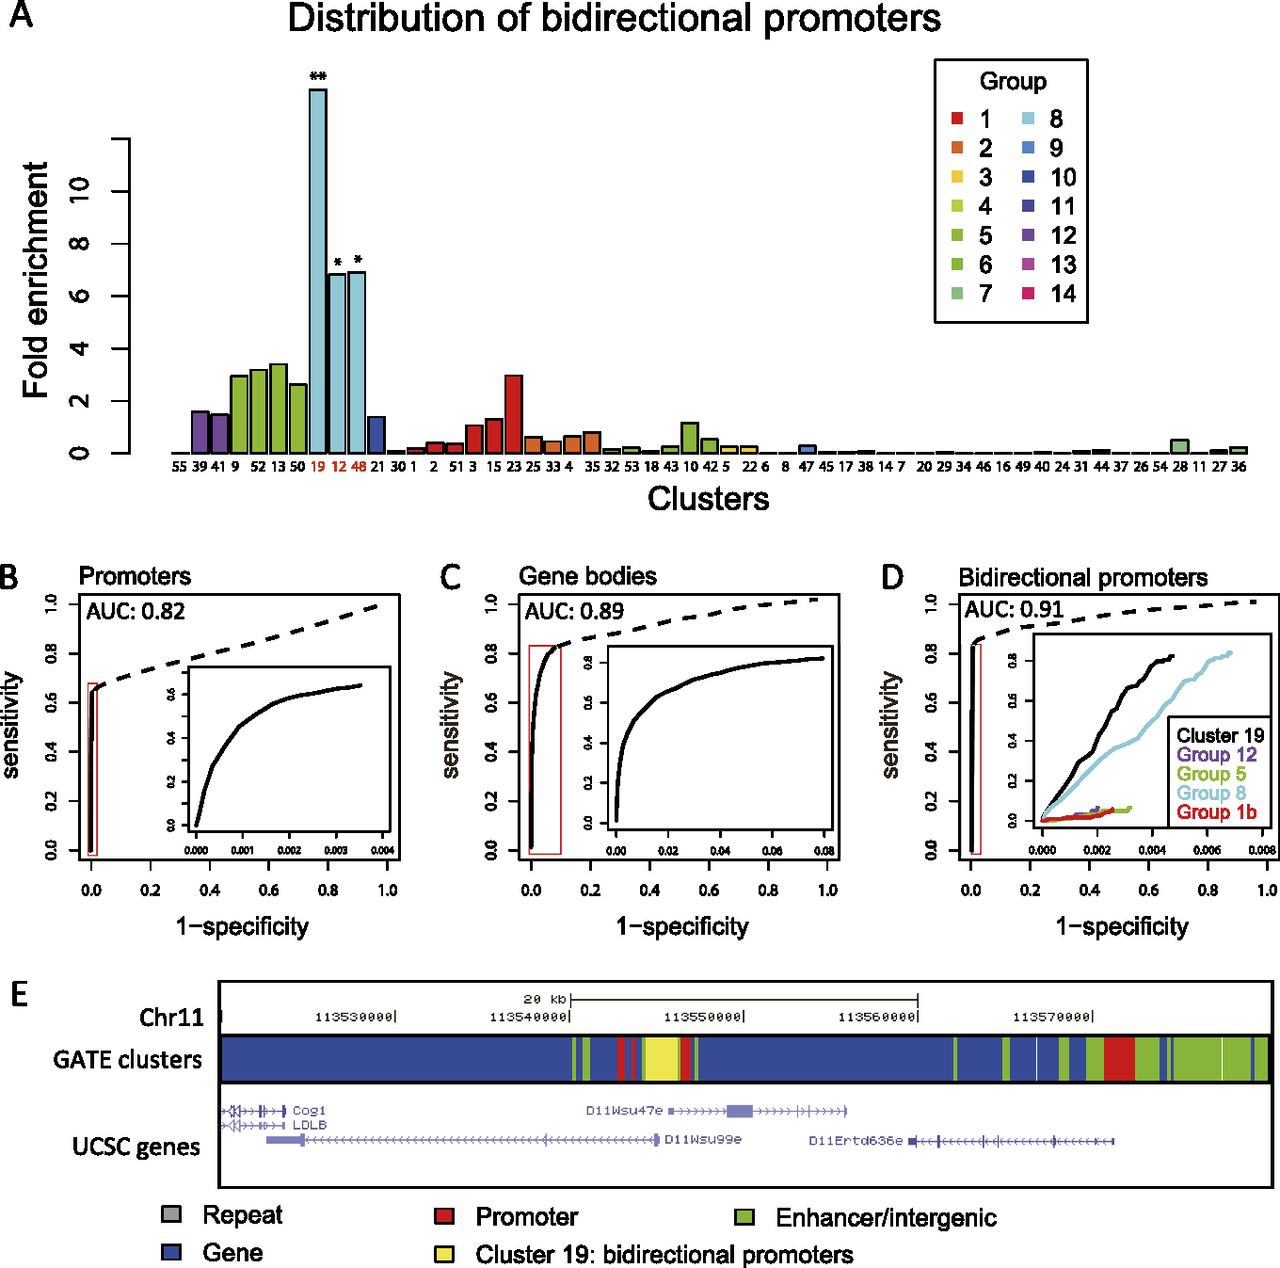
Predicting genomic features. (A) Distribution of bidirectional promoters in the 55 epigenomic clusters. Fold enrichment indicates the ratio between the percentage of bidirectional promoters in a cluster and the average percentage of all clusters. (*) P < 10−60; (**) P < 10−90. (B–D) Accuracies of predicting genomic features as measured by receiver operating characteristic (ROC) curves. AUC indicates area under the curve. Promoters were predicted by groups 1b, 5, 8, and 12 (P < 2.2 × 10⁻¹⁶, Wilcoxon test). Gene bodies were predicted by groups 1a, 4, 10, and 11 (P < 2.2 × 10⁻¹⁶). Bidirectional promoters were predicted by cluster 19 (P < 2.2 × 10⁻¹⁶). (Insets) Details of the high specificity regions. (E) A predicted bidirectional promoter and a regular promoter. Along a fraction of chromosome 11, each genomic segment is colored by the cluster it belonged to. The stretch of DNA belonging to cluster 19 (yellow) corresponded to a bidirectional promoter.


