
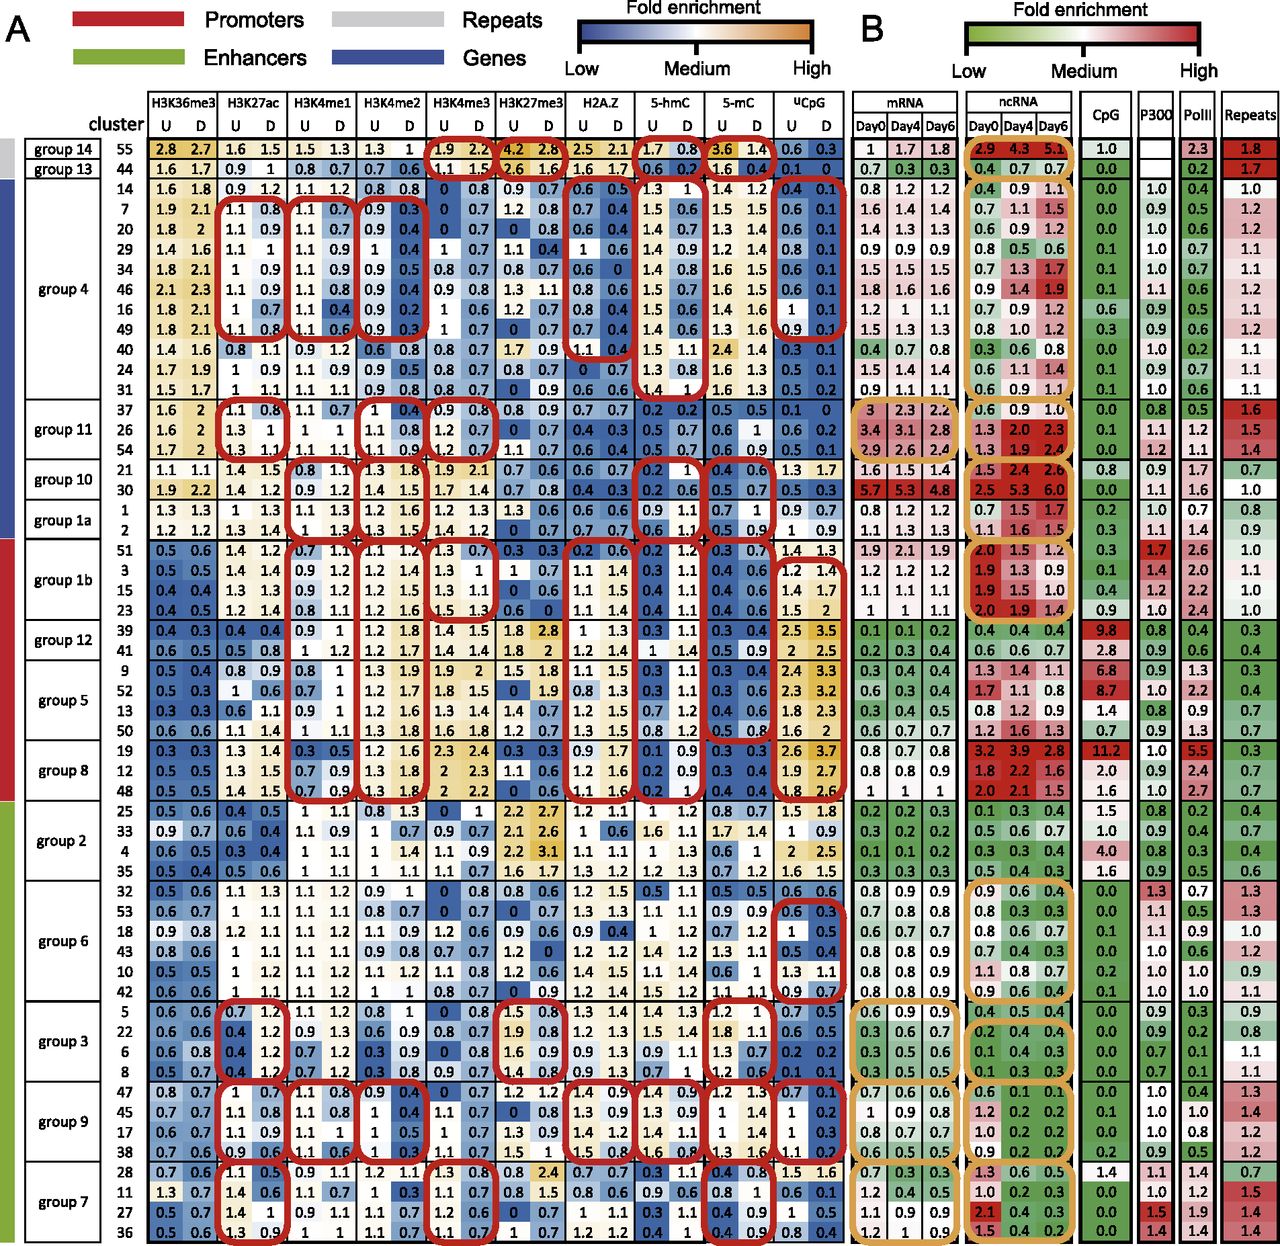
Epigenomic clusters. (A) Average intensities of each epigenomic mark (column) in each cluster (row). The model allows each sequence segment to have two activity states, denoted as undifferentiated (U) and differentiated (D). The model assumes that each cluster has a shared mean intensity for each epigenomic mark at either activity state. These mean intensities are plotted in this matrix and are color-coded. Clusters with similar intensities were merged into larger clusters (groups) (for the merging procedure, see Supplemental Fig. S3). Based on the epigenomic patterns, the groups were assigned with representative names, including promoters, enhancers, genes, and repeats (vertical color bars). Consistent intensity changes across multiple clusters in a group are highlighted (red circles). (B) Fold enrichment of genomic and epigenomic features (column) in each cluster (row). Fold enrichment was calculated as the ratio between the average signal of a cluster to the average signal of all clusters. mRNA indicates transcription levels of nearest genes, derived from RNA-seq data; ncRNA, transcription levels of the genomic segment in each cluster, derived from ncRNA-seq data; CpG, CpG density; P300, EP300 (also known as p300) binding intensity; PolII, PolII binding intensity; and repeats, repeat density. Significant temporal changes are highlighted (orange circles).


