
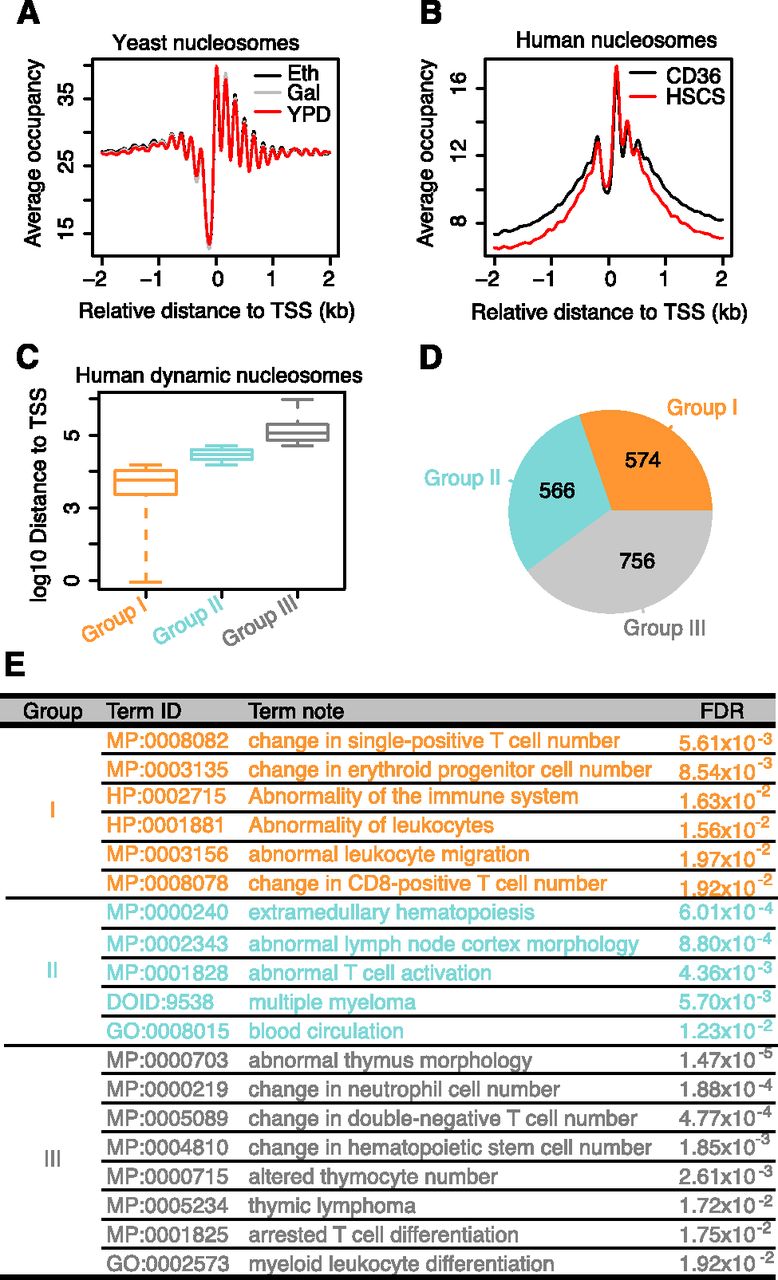
DANPOS defines functional dynamic nucleosomes in both promoter proximal and distal regions in the human genome. (A) Average nucleosome occupancy plotted as a function of distance to the nearest yeast TSS. (B) Average nucleosome occupancy plotted as a function of distance to the nearest human TSS. (C) Boxplots showing relative distance of human dynamic nucleosome to the nearest TSS. The dynamic nucleosomes during differentiation of human hematopoietic stem cells (HSCs) to CD36+ cells were divided into three groups. (D) Pie chart showing the number of human dynamic nucleosomes in each group. (E) Enrichment of function terms for each group. GREAT (Mclean et al. 2010) was used to analyze the functional significance of dynamic nucleosomes in each group.


