
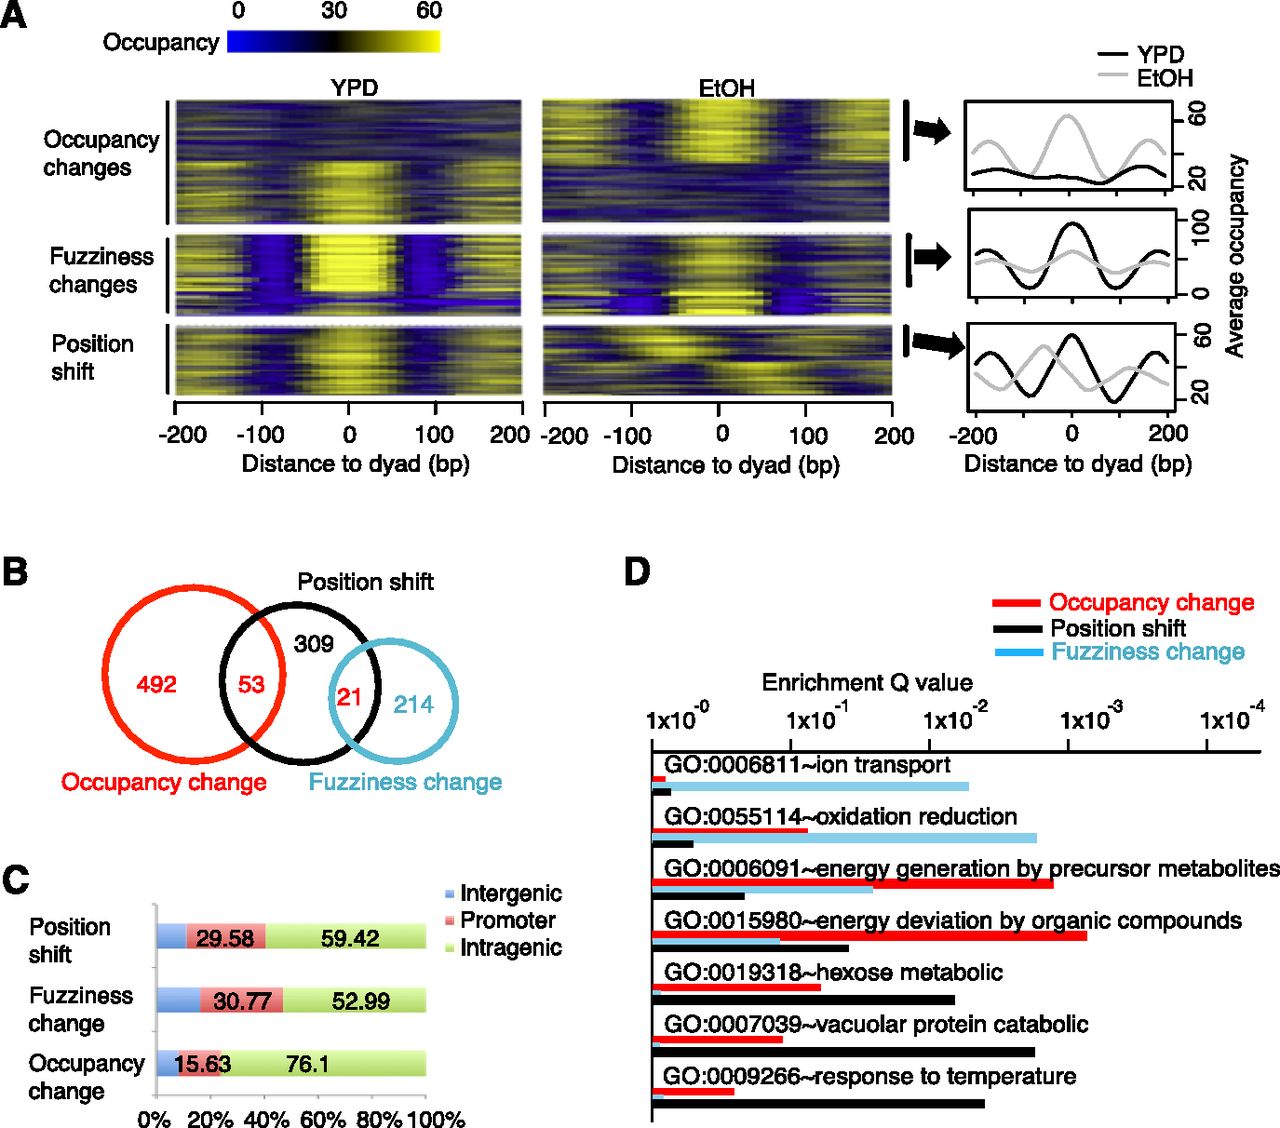
DANPOS classifies dynamic nucleosomes as position shifts, fuzziness changes, and occupancy changes. (A) Heatmaps (left and middle) and average profile plot (right) to show nucleosome occupancy in regions containing EtOH-YPD dynamic nucleosomes. Each line in the heatmaps represents a 400-bp region flanking the dyad of a dynamic nucleosome; for position shifts, the heatmap for the EtOH condition is plotted flanking the dyads defined in the YPD condition. Nucleosomes showing EtOH-YPD occupancy increase (top right), fuzziness increase (middle right), or position shift toward the 5′ direction on positive strand (bottom right) were pooled to plot average occupancy at each base pair flanking dyads. (B) Venn diagram for the overlap between different categories of EtOH-YPD dynamic nucleosomes. (C) The percentage of EtOH-YPD dynamic nucleosomes in intergenic, promoter, and intragenic regions, as defined in Figure 2B. (D) Enrichment of biological processes in each category of EtOH-YPD dynamic nucleosomes.


