
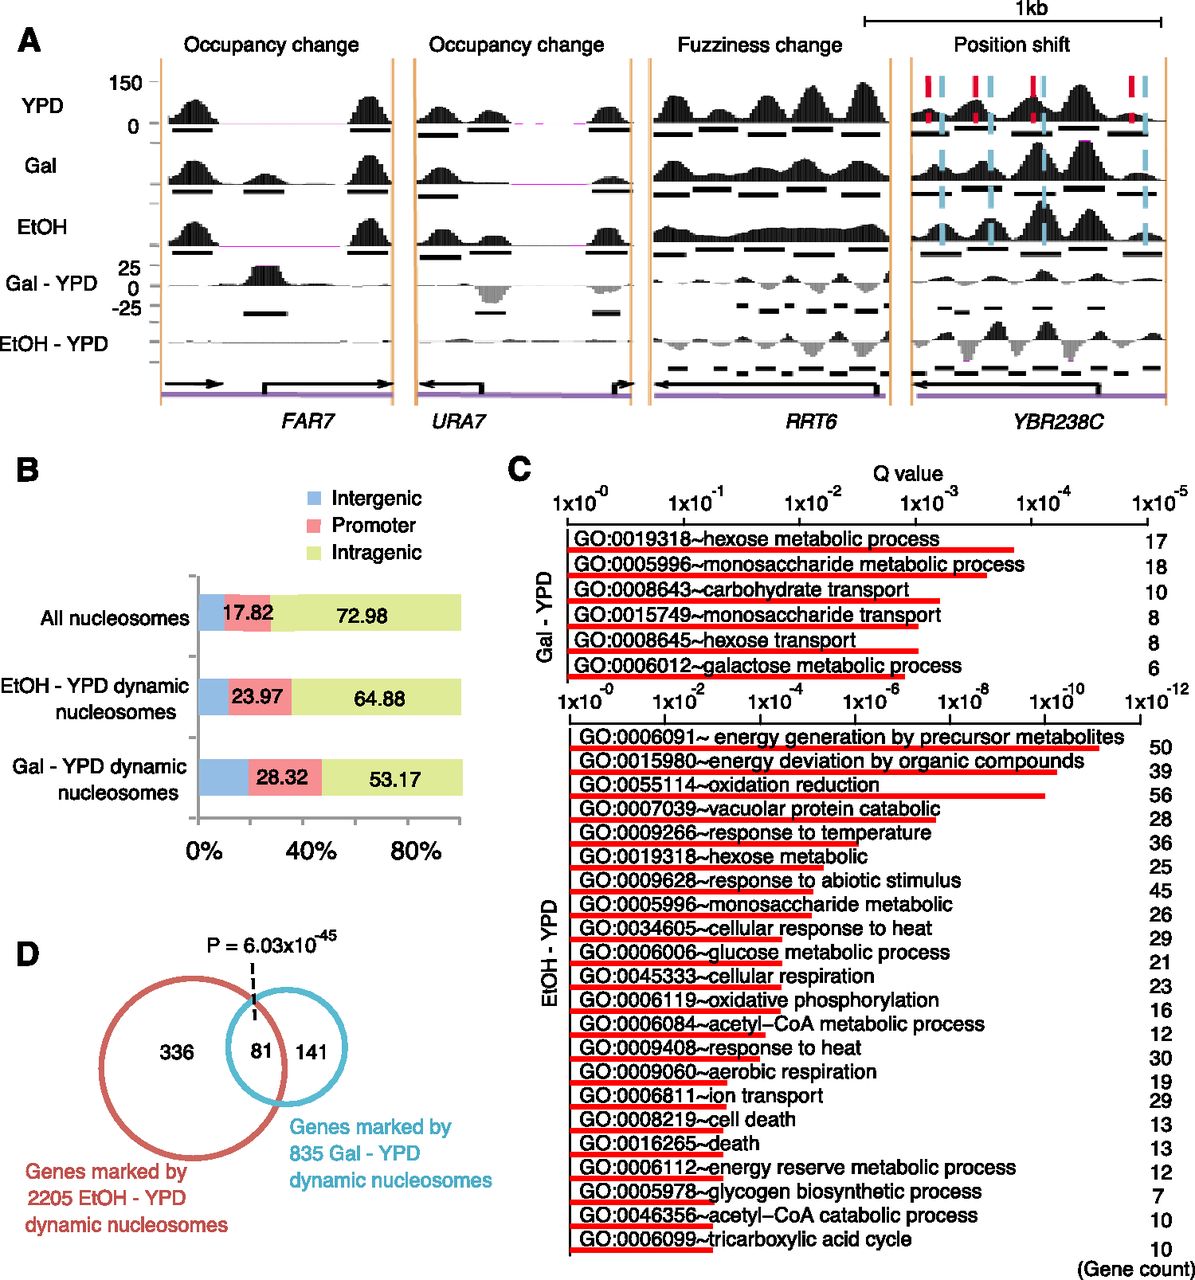
Dynamic nucleosomes identified by DANPOS explain environmental changes. (A) Snapshots of individual dynamic nucleosome regions. Categories of dynamic nucleosomes were labeled on top of each region. Nucleosome occupancies in YPD, Gal, and EtOH conditions were plotted as black areas in the top three tracks, where black bars in each track represent baseline nucleosome peaks. Nucleosome differential signals between YPD and Gal (Gal-YPD) or EtOH (EtOH-YPD) are plotted as black (positive) or gray (negative) areas in the bottom two tracks, and black bars in these tracks represent dynamic nucleosome peaks. (Black arrows) Position and direction of genes. Red and sky-blue dashed lines in the position shift plot indicate the dyads of nucleosomes in the YPD and EtOH conditions, respectively. (B) The percentages of dynamic nucleosomes in intragenic, promoter, and intergenic regions. Promoter is defined as the −350 to +50-bp regions flanking each TSS. Intragenic region is defined as the region from 50 bp downstream from the TSS to the 3′ end of the gene, and all remaining regions are defined as intergenic. (C) Enrichment of biological processes in genes associated with dynamic nucleosomes on promoters. (D) Counts of genes associated with dynamic nucleosomes on promoters.


