
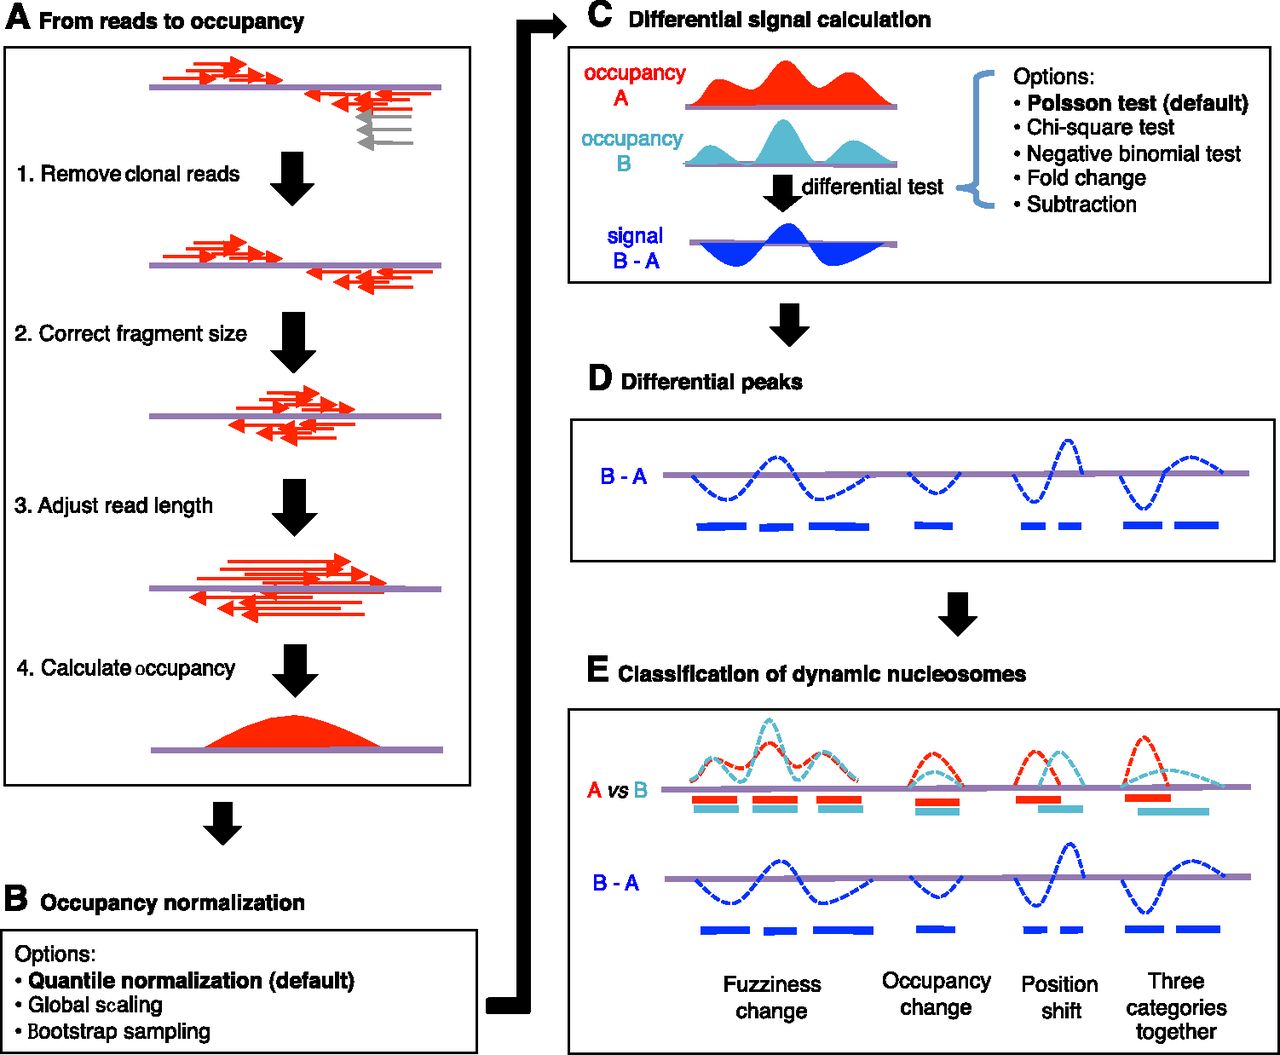
Flowchart of the nucleosome dynamic analysis pipeline in DANPOS. (A) Schematic illustration of nucleosome occupancy calculation. (Purple line) DNA sequence. (Red arrows) Normal reads at both ends of a nucleosome; (gray arrows) clonal reads. (Red areas) Calculated nucleosome occupancy. (B) The alternative data normalization methods. (C) Calculation of differential signals at single nucleotide resolution. (Red and sky-blue areas) Nucleosome occupancies in samples A and B, respectively. (Blue area) Differential signal at single nucleotide resolution between samples A and B. Five statistical tests that can be used to calculate differential signal are listed on the right. (D) Differential nucleosome peaks. (Blue dashed curves) Differential signals at single nucleotide resolution. (Blue bars) Differential nucleosome peaks called based on the differential signals. (E) A cartoon to show the three categories of dynamic nucleosomes. (Red and sky-blue dashed curves) Nucleosome occupancy in samples A and B, respectively. (Red and sky-blue blocks) Baseline nucleosome peaks with differential signals and peaks displayed as in D.


