
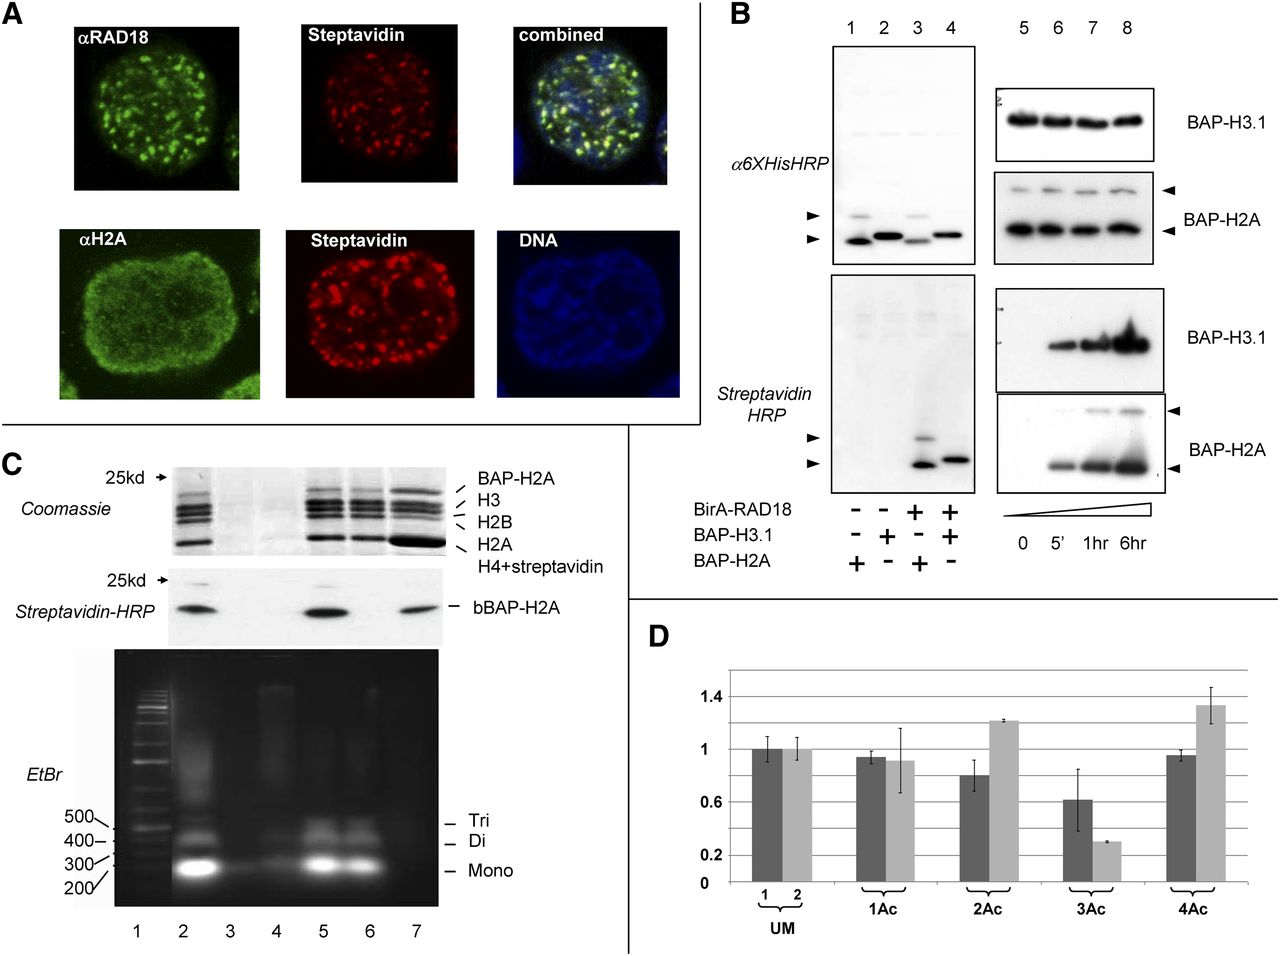
PUB-NChIP reveals a specific pattern of H4 acetylation in the RAD18-proximal chromatin. (A) Chromatin is biotinylated at the sites of RAD18 foci. Confocal microscopy analysis of colocalization of RAD18 and biotinylated chromatin (top) or H2A histone and biotinylated chromatin (bottom). (B) Biotinylation signal is due to BAP-H2A in proximity to BirA-RAD18. (Left) Western blot analysis, showing that a specific biotinylation signal appears only after BirA-RAD18 and BAP-histone are cotransfected. (Lane 1) BAP-H2A alone; (lane 2) BAP-H3.1 alone; (lane 3) BirA-RAD18 + BAP-H2A; (lane 4) BirA-RAD18 + BAP-H3.1. The two forms of H2A (nonubiquitinated and ubiquitinated), both biotinylated in this experiment, are indicated by arrows. (Top) α−6×His antibodies; (bottom) streptavidin-HRP. (Right) Western blot analysis of the biotinylation status of BAP-H2A and BAP-H3.1 after different times of biotin-labeling. (Top) α-His antibodies; (bottom) streptavidin-HRP. (C) Purification of biotinylated chromatin. (Top) SDS-PAGE gel stained with Coomassie blue, with the identities of the histones indicated. The H4 band in the elution also contains streptavidin and thus is thicker than the other histone bands. (Middle) Western blot analysis of the same samples with streptavidin-HRP, showing that all biotinylated BAP-H2A was affinity-purified with immobilized streptavidin. (Bottom) Agarose gel electrophoresis and ethidium bromide staining for the same samples, showing that mainly the mononucleosome fractions were generated after micrococcal digestion. (Lane 1) Molecular weight marker; (lane 2) nuclei lysate after micrococcal digestion; (lane 3) supernatant after micrococcal digestion; (lane 4) nuclear pellet after salt extraction; (lane 5) chromatin extracted by 0.4M NaCl; (lane 6) chromatin (from fraction 5) unbound to streptavidin-sepharose; (lane 7) eluate (see Methods for details). Note that to make the final preparation visible on Coomassie SDS-PAGE (top panel), we have loaded larger amounts of the eluate fraction, compared to all other fractions. However, for the middle and bottom panels, all fractions are loaded in equal amounts, corresponding to the same number of cells. (D) Relative acetylation status of H4 N-terminal tails (aa 4–17). The presence of a particular peptide was monitored by MRM. For the mono-, di-, and triacetylated peptides, it was difficult to distinguish between modifications at different lysine positions. Hence, we present results without reference to the position. Due to the variations in ratio between the heavy and light isotope-labeled chromatin in each experiment, the H/L ratio for every peptide has been normalized by dividing it by the H/Lum ratio for the unmodified peptide (UM). The graph presents the average normalized H/M ratios and standard deviations for all modified peptides from two independent experiments. The standard deviation for the unmodified peptide represents the standard deviation for the H/L value for this peptide (as H/Lum) in two different experiments. For each pair of columns, 1 corresponds to heavy isotope-labeled cells transfected with BirA-GFP + BAP-H2A, and 2 corresponds to the heavy cells transfected with BirA-RAD18 + BAP-H2A. The light isotope-labeled cells were always transfected with BirA-GFP + BAP-H2A.


