
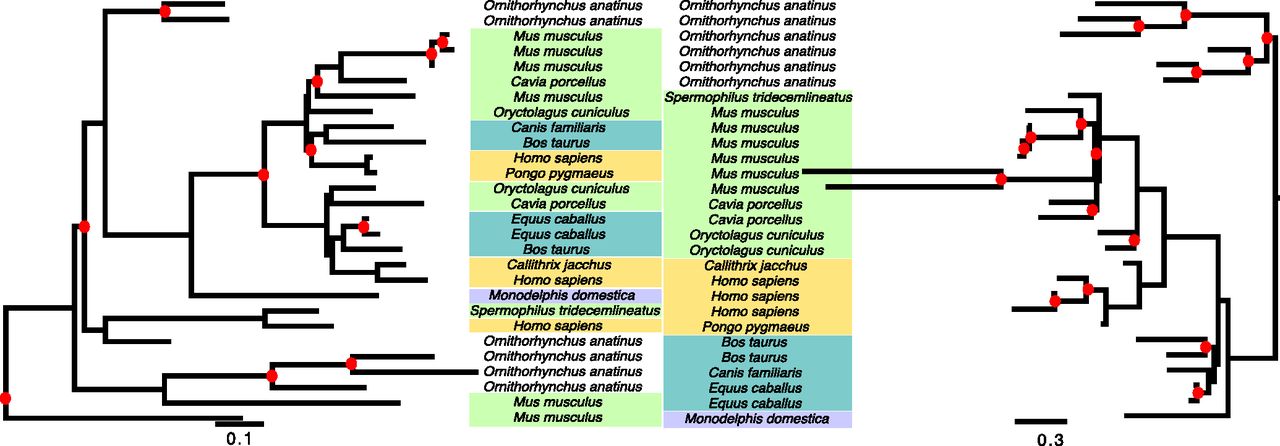
Figure 5.
Reconciled trees reconstructed by TreeBeST (left) and by PHYLDOG (right) for gene family containing human gene coding for protein ENSP00000391561, “T-cell receptor, gamma, variable region V9.” Gene names have been replaced by species names (see Supplemental Fig. S11 for original gene names). Although PHYLDOG predicts more duplications (red dots) than TreeBeST, it proposes a scenario more consistent with ancestral chromosomal organizations (proportion of ancestral genes with two neighbors: TreeBeST: 0.29, PHYLDOG: 0.54).


