
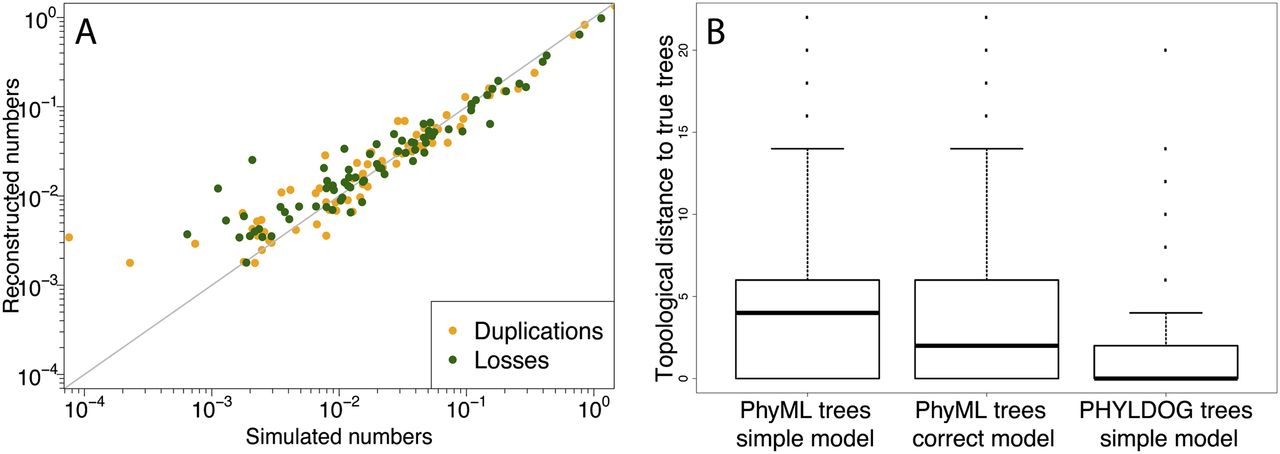
Figure 2.
(A) Correlation between the expected and reconstructed numbers of duplications and losses per gene and per branch of the species tree. The x = y line is in gray. (B) Topological (RF) (Robinson and Foulds 1979) distance to the true gene family trees of the trees reconstructed by PHYLDOG under a simpler model of sequence evolution (JC69) than that used in the simulation (HKY85 with rate heterogeneity among sites) and by PhyML under the same simple model and under the correct model of evolution. For PHYLDOG, the median RF distance to the true tree is at 0.


