
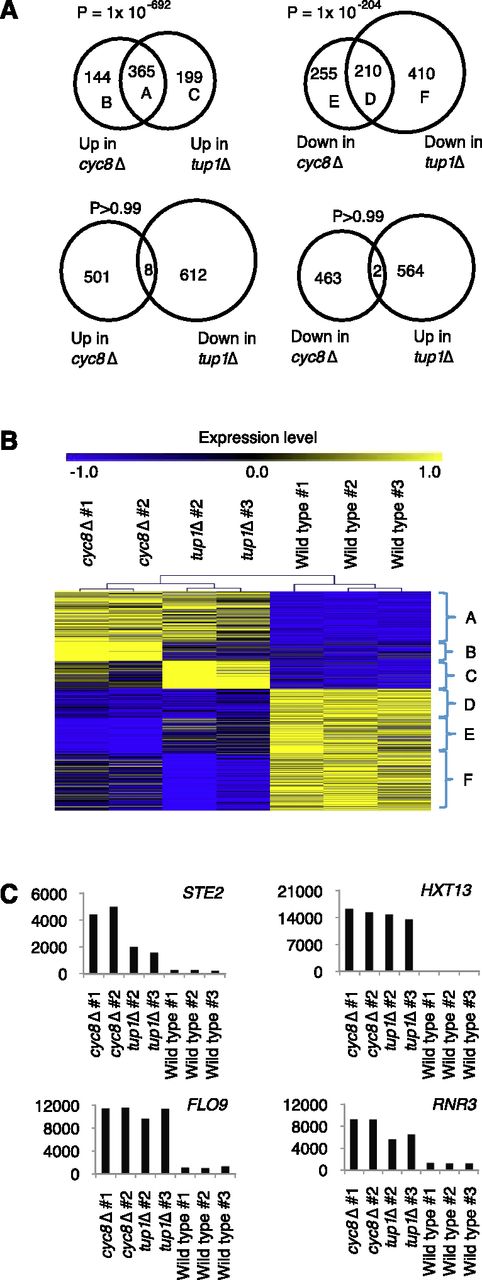
Cyc8 and Tup1 show common and individual global effects on transcriptional regulation. (A) Venn diagram showing the overlap of regulated genes (Q-value <0.05; fold change >1.5) in cyc8Δ or tup1Δ strain relative to wild-type strain. The overlap P-value is estimated based on a Fisher's exact test. (B) A heat map to show gene expression level in each sample. Each row represents a differentially expressed gene in the cyc8Δ or tup1Δ strain relative to the wild-type strain, and each column represents a sample. Samples were hierarchically clustered, and the expression values for each gene from all seven samples were scaled to a range between −1 and 1. Nucleosomes were grouped and labeled based on the Venn diagrams in A. (C) Histograms showing expression levels of four known Cyc8–Tup1 target genes in cyc8Δ, tup1Δ, and wild-type strains.


