
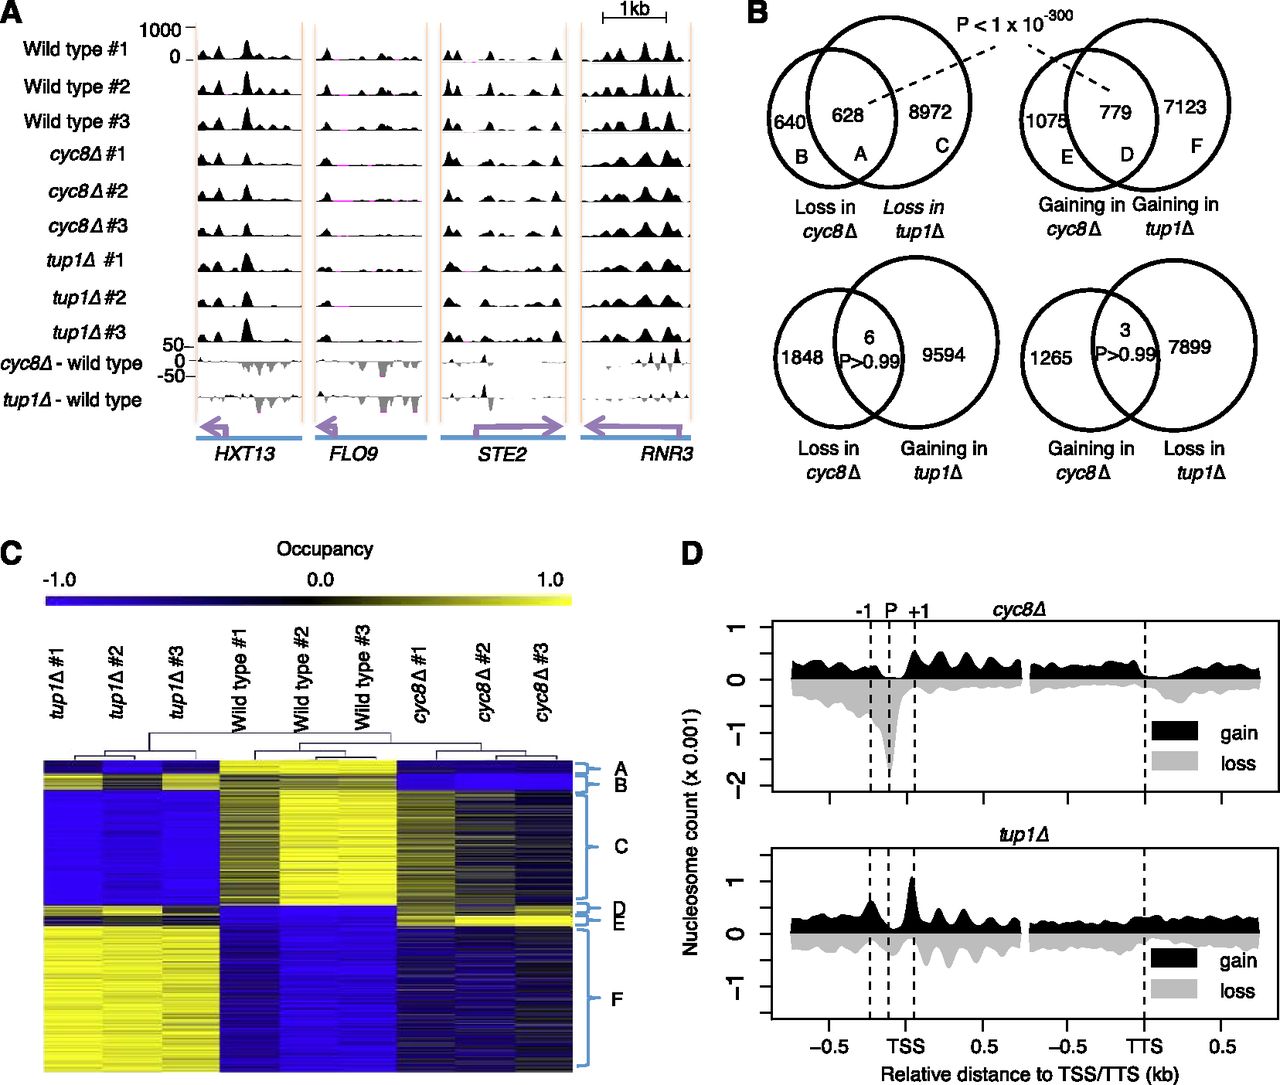
Cyc8 and Tup1 show common and individual global effects on nucleosome positioning. (A) Snapshots of the nucleosome maps on some known target genes of the Cyc8–Tup1 complex. The gene locus (purple arrows) is labeled at the bottom. Each of the top nine tracks represents nucleosome occupancy (black area) in one sample, with the sample name labeled at left. The cyc8Δ-Wild-type and tup1Δ-Wild-type tracks show the occupancy differences between the corresponding strains, with nucleosome gain (black; positive) or nucleosome loss (gray; negative) plotted separately. (B) Venn diagrams showing the overlapping nucleosome gain and loss events of cyc8Δ and tup1Δ strains. The overlap P-value is estimated based on a Fisher's exact test. (C) A heat map to show occupancy of each nucleosome in each sample. Each row represents a nucleosome, and each column represents a sample. Only nucleosomes showing altered occupancy in cyc8Δ or tup1Δ strains were used in the plot. Samples were hierarchically clustered, and for each nucleosome, the occupancy values from all nine samples were scaled to a range between −1 and 1. Nucleosomes were grouped and labeled based on the Venn diagrams in B. (D) Count of nucleosome gain or loss events plotted as a function of distance to the TSS or TTS.


