
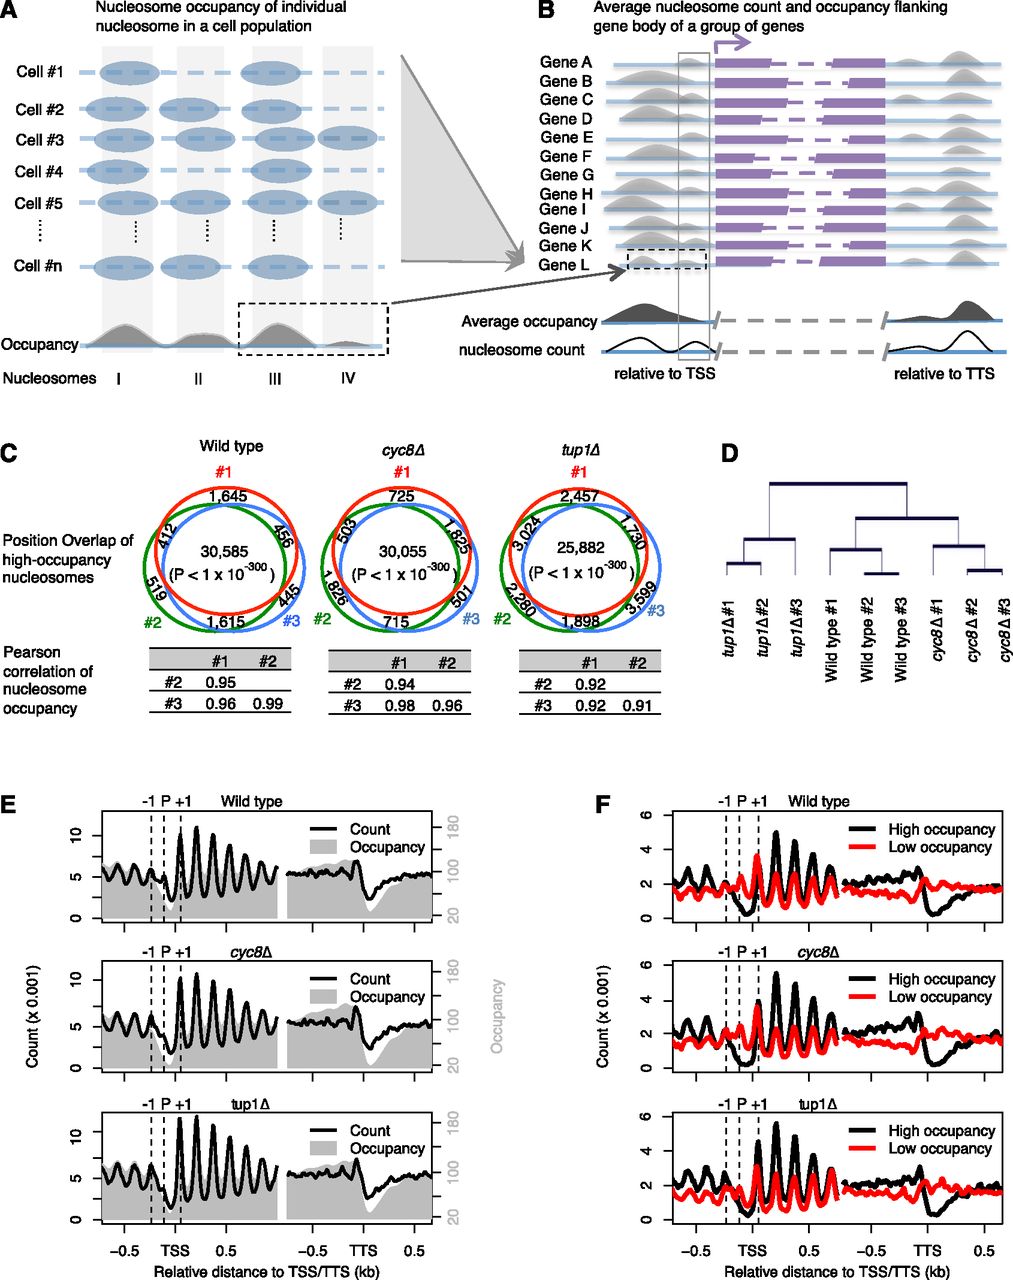
Nucleosome position and occupancy analysis based on high-quality maps enable observation of a P nucleosome on promoters. (A) A cartoon to show nucleosome position and occupancy analysis at a single genomic locus in a cell population. Theoretically, nucleosomes (blue ovals) may be located anywhere on a DNA fragment (blue solid line); “nucleosome occupancy” refers to the frequency at which nucleosomes present at a specific position. Technically, nucleosome occupancy can be measured by local sequencing depth (gray area under curve) at each nucleotide across the genome, and nucleosomes (gray bars) can be defined as occupancy peaks whose sizes are close to a nucleosome unit length. (Blue dash lines) Copies of the same DNA fragment in different cells as labeled on left. (B) A cartoon to show nucleosome position and occupancy analysis relative to a putative gene group. When grouping nucleosomes based on a common genomic feature such as a transcription start site (TSS) or transcription terminal site (TTS), a group of nucleosomes (gray solid box) with high nucleosome count (solid curve) might not be observable due to lower average occupancy (black area under curve) relative to neighboring nucleosomes. (Purple bars and dashed lines) Different genes (labeled on left); (purple arrow) the transcription direction and TSS. (Blue solid lines) Genomic regions flanking a gene group. (Black dash boxes in A and B) The same putative genomic locus. (C) Venn diagrams representing the overlap of high-occupancy nucleosomes between replicates, with the Pearson correlation coefficients of nucleosome occupancy between replicates shown below. All nucleosomes are used for calculation of Pearson correlation coefficients, whereas the 50% nucleosomes ranked by occupancy were retrieved for estimation of position overlap, with the overlapping P-value estimated based on Fisher's exact test. (D) Hierarchical clustering of all nine samples based on nucleosome occupancy. The top 5% of nucleosomes ranked by standard deviation of occupancies among the nine samples were used in the unbiased clustering. (E) Average nucleosome occupancy and count plotted as a function of distance to the TSS or TTS. (F) Average nucleosome count of high- and low-occupancy nucleosomes plotted as a function of distance to the TSS or TTS.


