
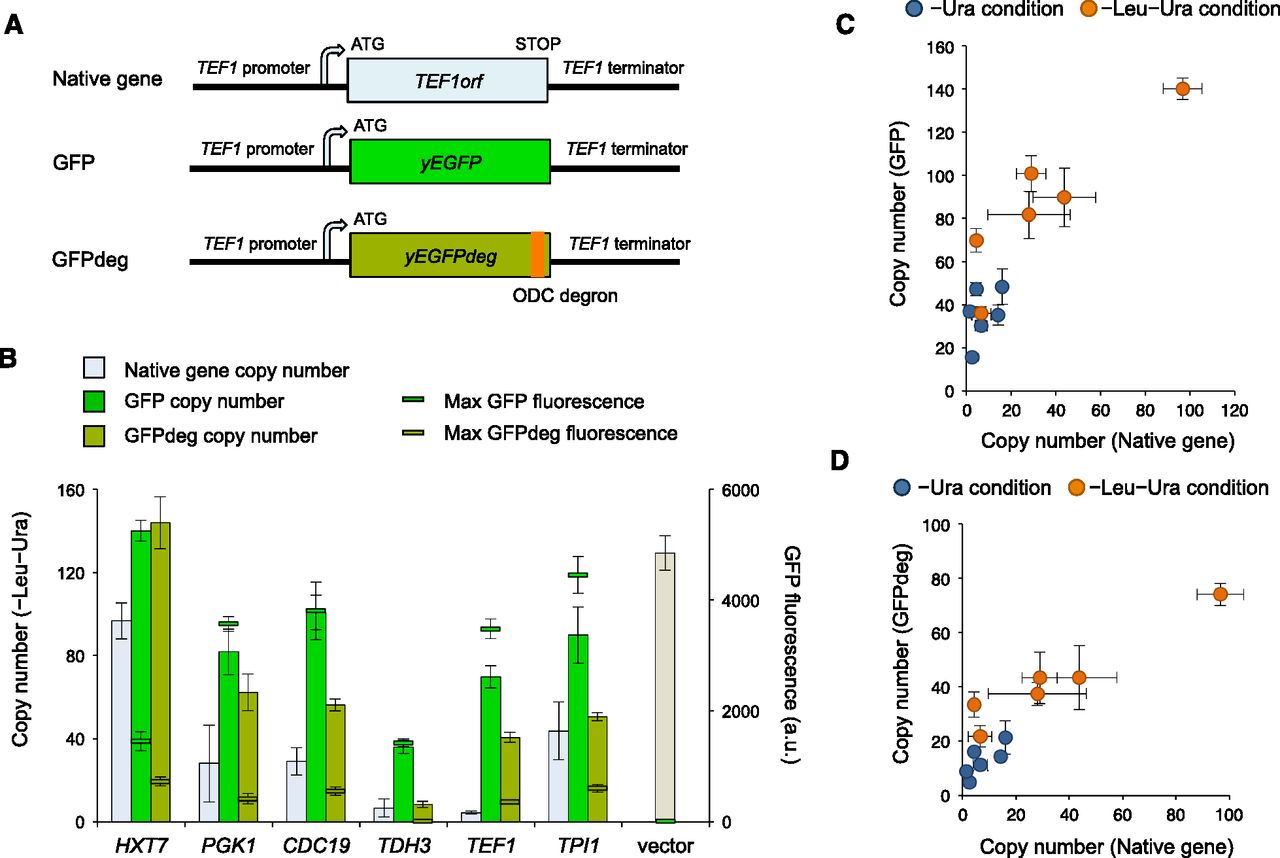
Protein burden causes dosage sensitivity. (A) Plasmid constructs to examine the protein burden. TEF1 is shown as an example of highly expressed target genes. We constructed these artificial genes using pTOW40836, introduced the plasmids into yeast strain BY4741, and then measured the upper CNLs and the maximal GFP fluorescence. ODC degron indicates the degron from the mouse ornithine decarboxylase gene (Jungbluth et al. 2010). (B) CNLs of native and GFP replaced genes. The gene names on the horizontal axis indicate that their ORFs were replaced by GFP, as shown in A. (C) Comparison of the copy numbers of native- and GFP-replaced genes. (D) Comparison of the copy numbers of native- and GFPdeg-replaced genes.


