
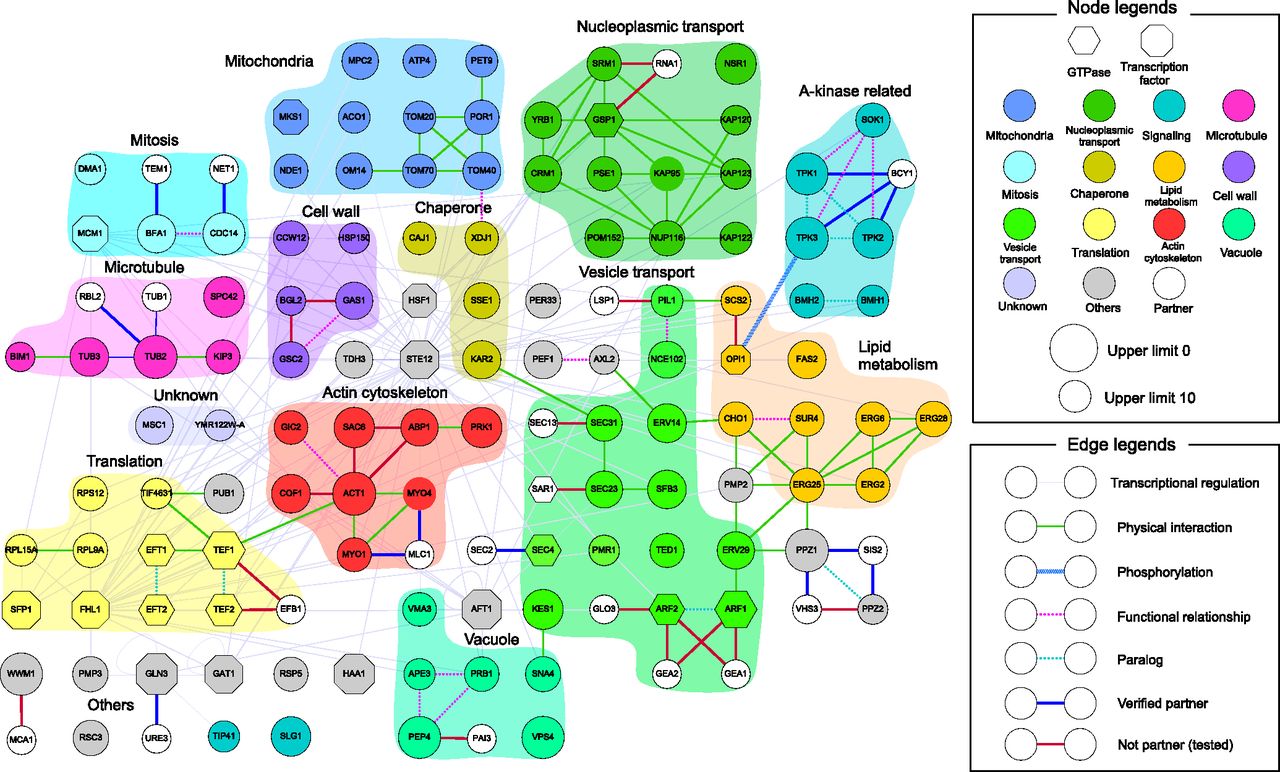
Molecular interactions between DSGs. Yeast DSGs were colored according to their functional category annotated in the Saccharomyces Genome Database (SGD). Genes were connected by their protein–protein interactions (solid lines), functional relationships (dotted lines), and protein–DNA interactions (thin lines). The interaction data were obtained from BioGRID (http://thebiogrid.org/). White-colored genes and bold lines denote the candidate partners and their interactions experimentally tested by 2D-gTOW, respectively (Fig. 7; Supplemental Figs. S11, S12; Table 3; Supplemental Table S7). The network was created using Cytoscape 2.8.1 (http://www.cytoscape.org/) and modified using Illustrator CS5 (Adobe) and PowerPoint 2011 (Microsoft).


