
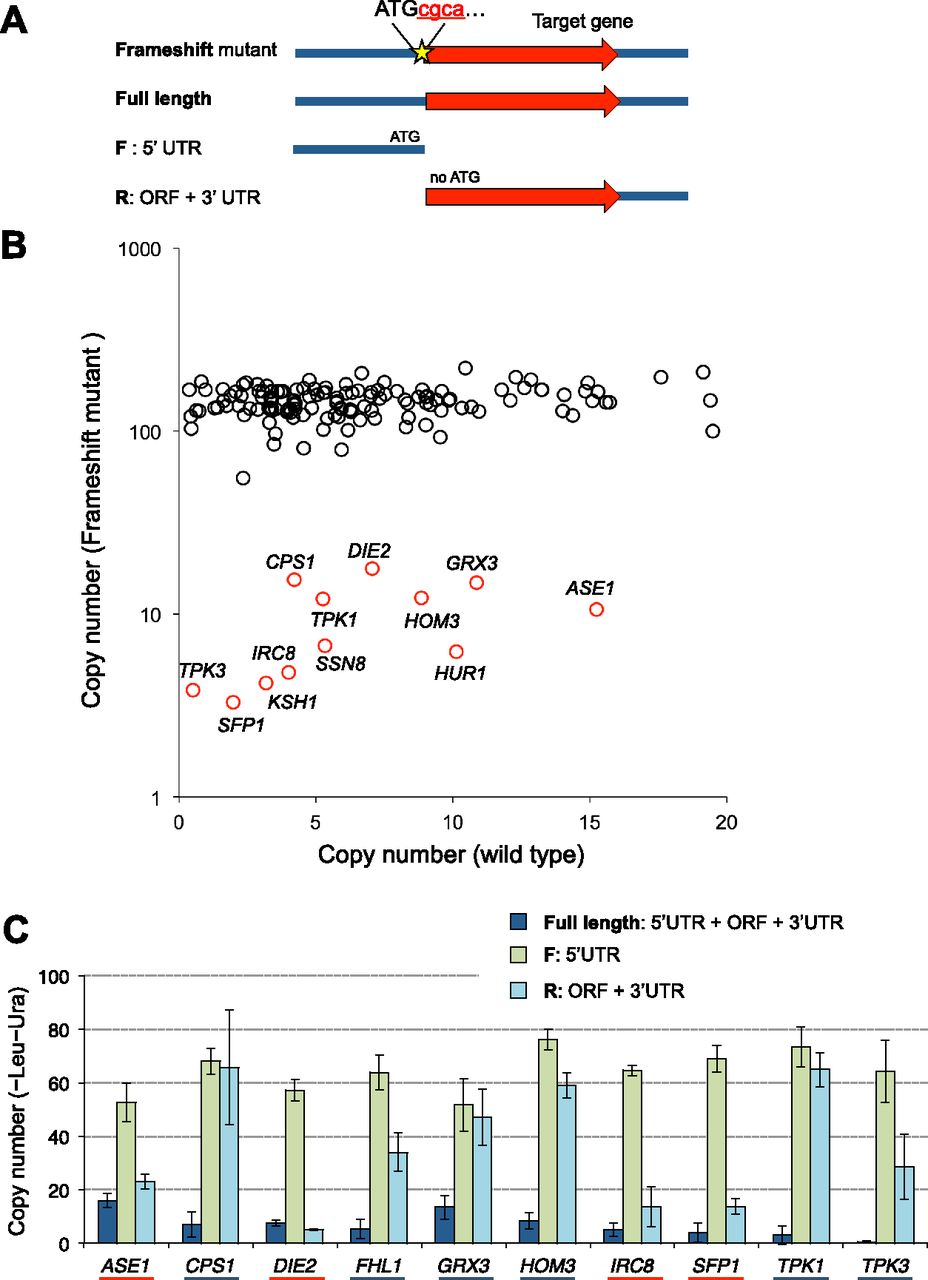
Frameshift and segmentation analyses of candidate low limit genes. (A) Structure of the plasmid used in frameshift analysis and segmentation analysis. (Red letters) The nucleotide inserted to generate frameshift. The introduced FspI site in the mutant is underlined. (B) A scatter plot of the CNLs of the wild-type genes and the frameshift mutants of low limit genes. (Black circles) Genes that displayed increased CNLs when frameshift was introduced. (Red circles) Genes that did not display increased CNLs even when frameshift was generated. Note that the frameshift mutants of AUA1, GAT1, and FHL1 could not be obtained, probably because their frameshift mutants also have very low limits. The raw data can be found in Supplemental Table S4. (C) CNLs of segmented genes. Genes underlined with a blue line are those that displayed increased CNLs upon segmentation. Genes underlined with a red line indicate genes that did not display increased CNLs upon segmentation.


