
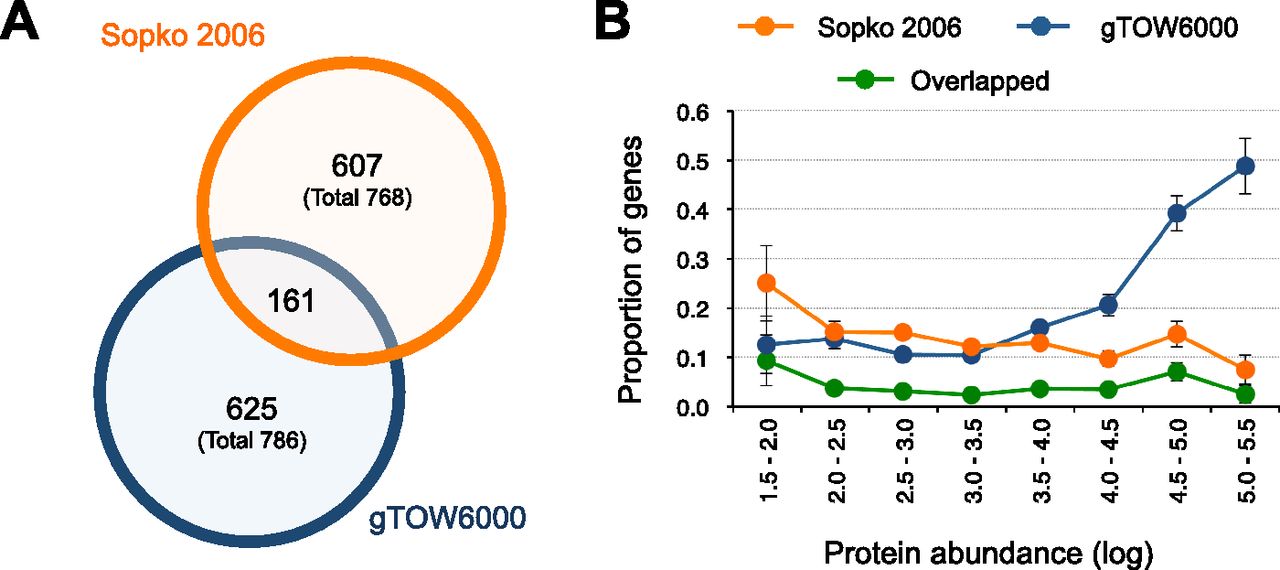
Figure 3.
Comparison of gTOW6000 data with data of another overexpression analysis performed using promoter swapping. (A) Overlap of genes identified by the overexpression analyses performed by Sopko et al. (2006) and in this study. (B) Distribution of genes identified by overexpression analysis ordered by their native protein levels. Each bin contains genes ordered by their native protein levels (Ghaemmaghami et al. 2003). The protein abundance unit is molecules per cell. Error bars, SEM.


