
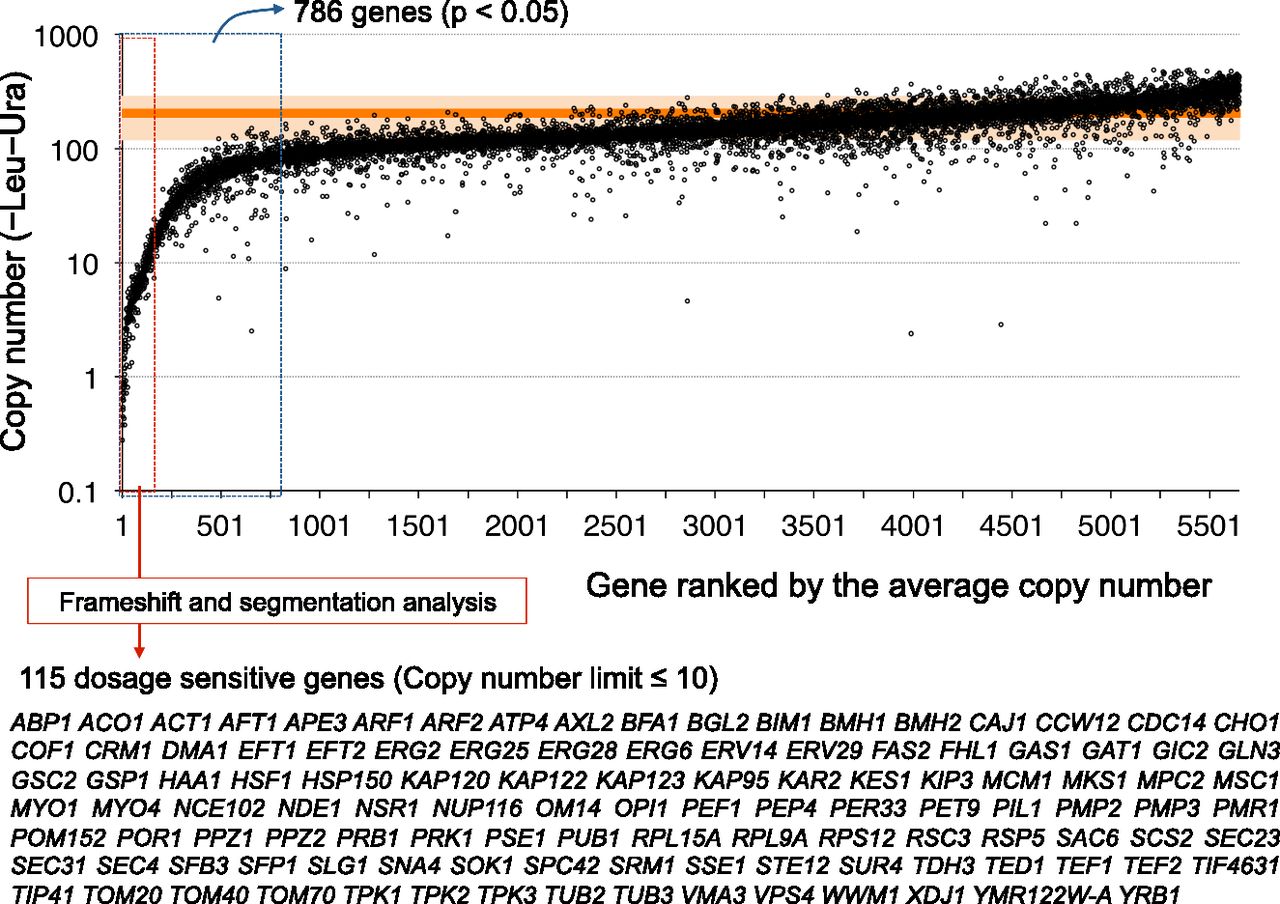
Copy number limits (CNLs) of S. cerevisiae genes determined by gTOW analysis. Genes were ordered according to their average copy number determined by gTOW under the −Leu−Ura condition. Each gene has two data points because of the duplication of the experiment. The orange line and the transparent zone around the line indicate the average copy number with the empty vector and the standard deviation, respectively. Genes that showed significantly lower limits than those observed in the vector experiments (786 genes, P < 0.05) are surrounded by the blue dotted rectangle. Genes with CNLs of 10 and less (dosage-sensitive genes [DSGs]) are surrounded by the red-dotted rectangle. A confident set of DSGs isolated after frameshift and segmentation analyses (Fig. 4) is shown. The entire data set is given in Supplemental Table S1.


