
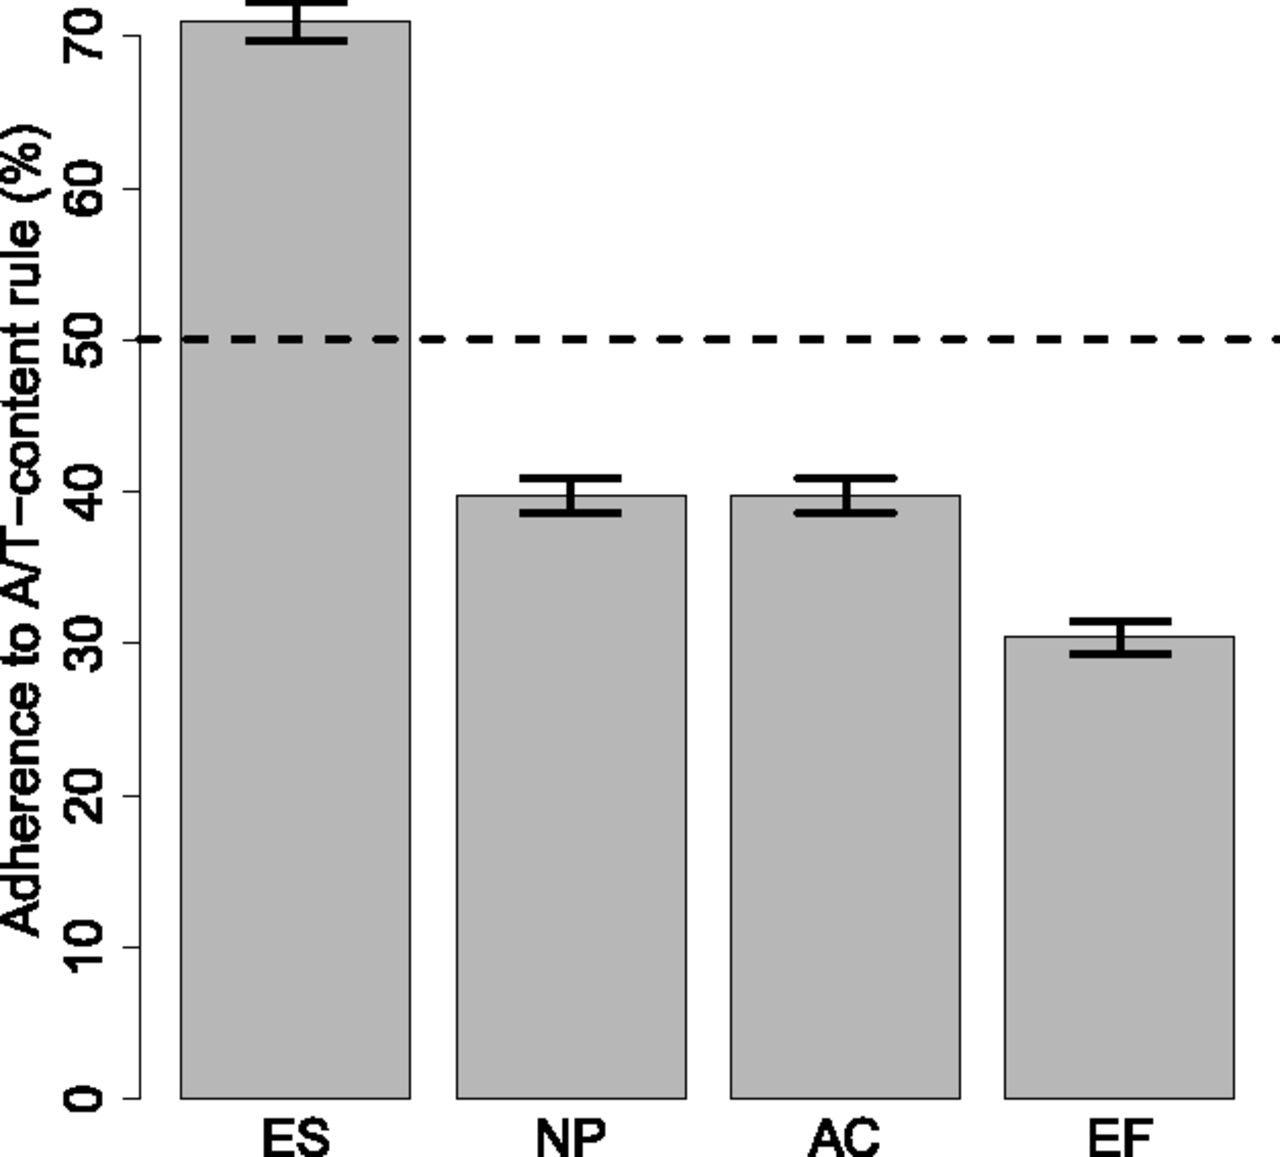
Figure 4.
A/T-content rule during differentiation. Adherence to A/T-content rule by regions that show cell-type specific lamin interactions, as measured by classification accuracy using the classifier (k = 1) trained on cLAD and ciLAD regions. Bars show mean bootstrapped classification accuracies, with error bars indicating standard deviation. (Dotted horizontal line) Random performance.


