
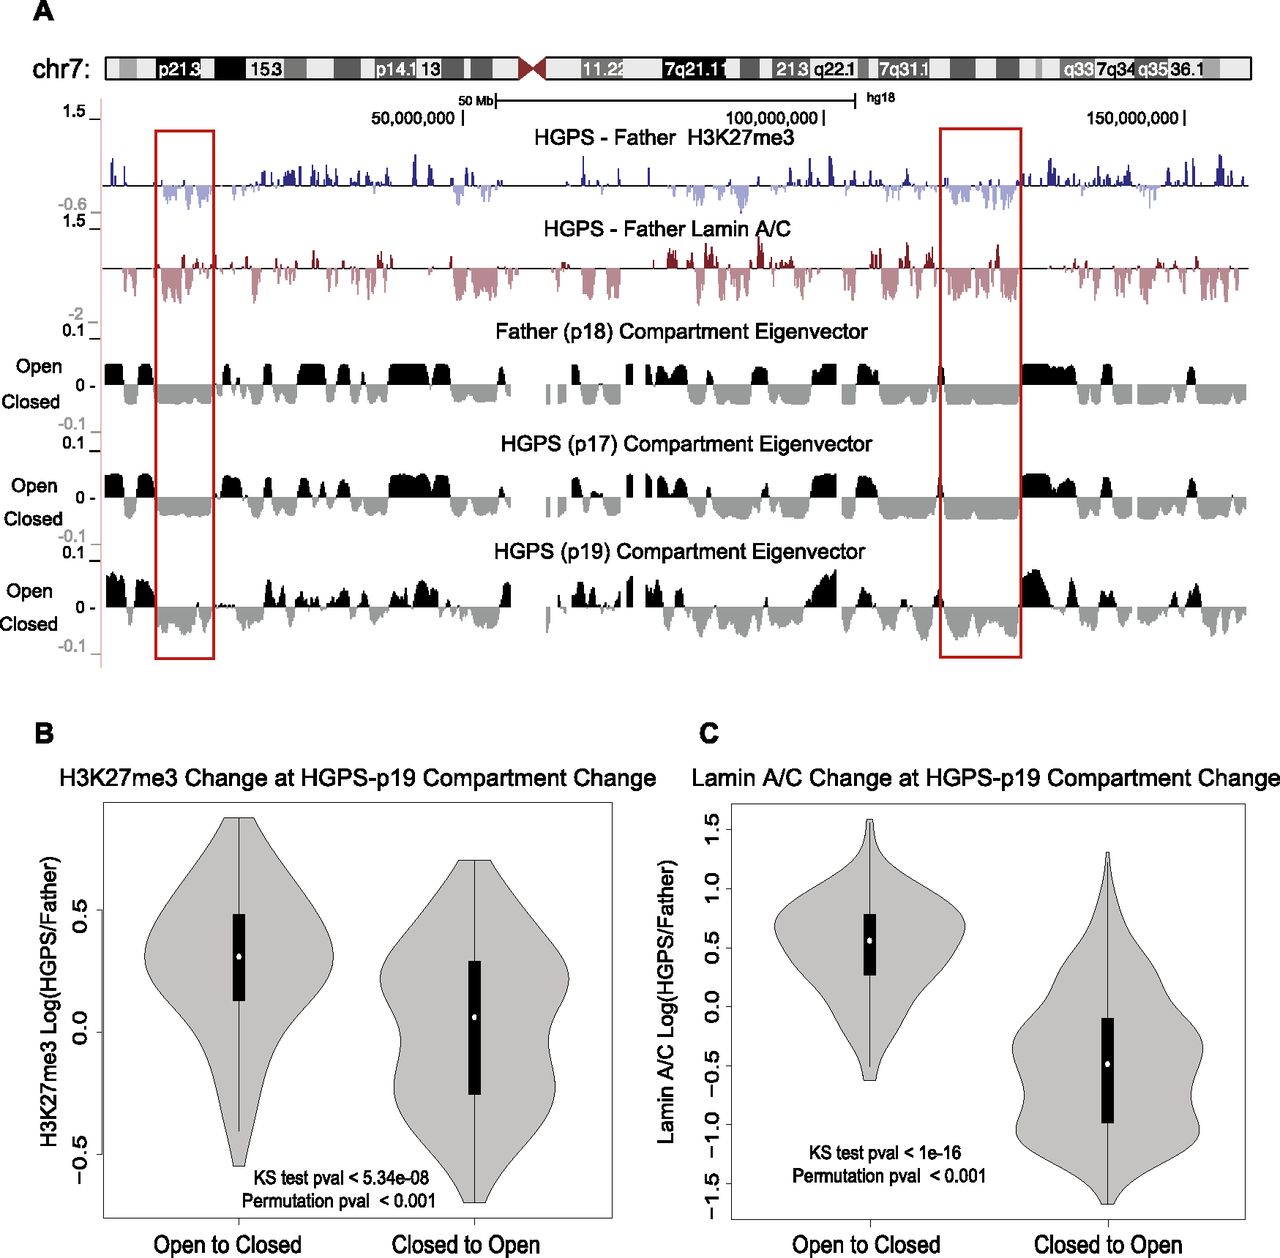
H3K27me3 and lamin changes correspond with compartment changes from control to HGPS cells. (A) Comparison of compartment structure in control and HGPS cells with changes in H3K27me3 and lamin A/C binding between control and patient on chromosome 7. Compartment tracks are at 1-Mb resolution, smoothed with a 200-kb step size while lamin and H3K27me3 change tracks are at 200-kb resolution, plotted as in Figures 1 through 3. Positive values of the compartment eigenvector (derived from principal component analysis) correspond to domains of open chromatin, while negative values correspond to the closed chromatin compartment. (Red boxes) Examples of closed compartment regions with a decrease in H3K27me3 or lamin A/C binding in HGPS cells. (B) Comparison of the distribution of H3K27me3 change at sites of compartment change. The distribution of H3K27me3 log ratios (control/HGPS) are shown in a violin plot for 1-Mb bins that changed from open to closed (“AtoB,” left) or closed to open (“BtoA,” right). The H3K27me3 values show significantly higher increases for AtoB regions than for BtoA regions as evaluated by a KS test and a circular permutation of the data (1000 permutations). (C) The distributions of lamin A/C binding log ratios (control/HGPS) are displayed vs. compartment change as in B. Lamin A/C binding increases at genomic regions that change from open to closed and decreases at regions that change from closed to open.


