
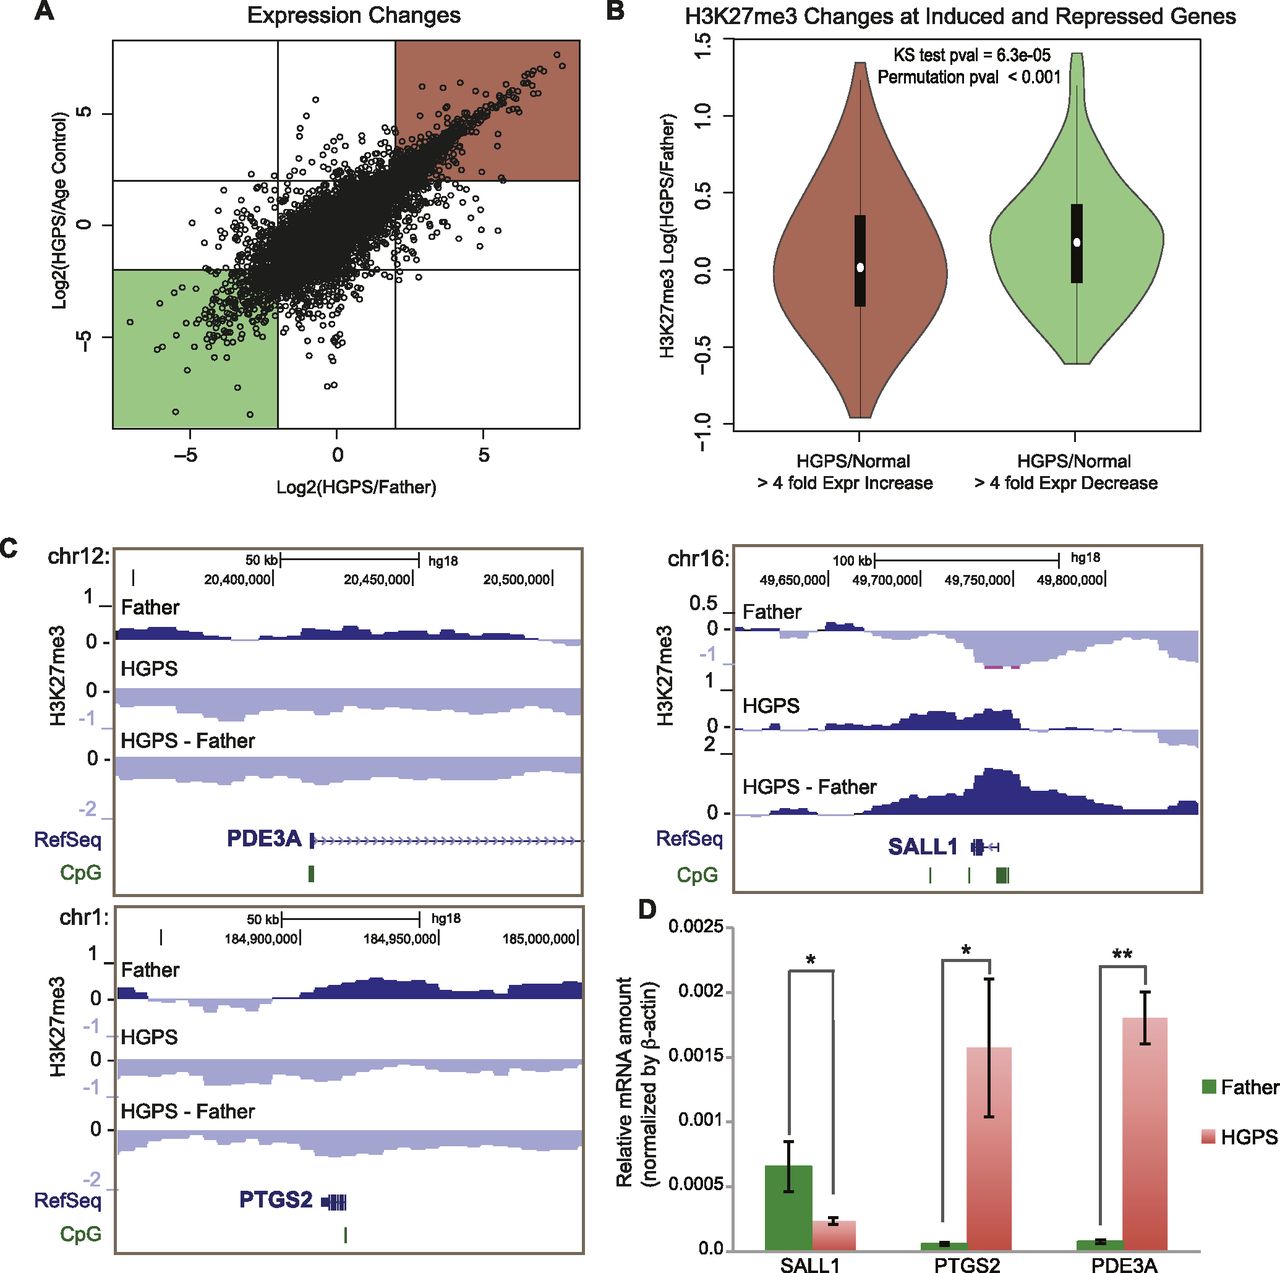
Changes in H3K27me3 associated with changes in gene expression in HGPS. (A) Scatterplot of Log2 ratio expression changes between HGPS and Age Control (y-axis) and HGPS and Father (x-axis). Red and green boxes indicate genes considered “up-regulated” and “down-regulated” (more than fourfold), respectively, for subsequent analyses. (B) H3K27me3 changes between Father and HGPS in the 25-kb bin overlapping each gene are plotted on the y-axis for genes that are up-regulated (left) or down-regulated (right). H3K27me3 tends to decrease in HGPS for up-regulated genes and increase for down-regulated genes. (C) Examples of H3K27me3 changes for genes that are up-regulated (left, PDE3A and PTGS2) and that are down-regulated (right, SALL1) according to the expression microarray data in normal vs. HGPS fibroblasts. (D) Quantitative RT-PCR results confirm expression microarray results for these three example genes (*) P < 0.05; (**) P < 0.01 in unpaired, one-tailed Student's t-tests.


