
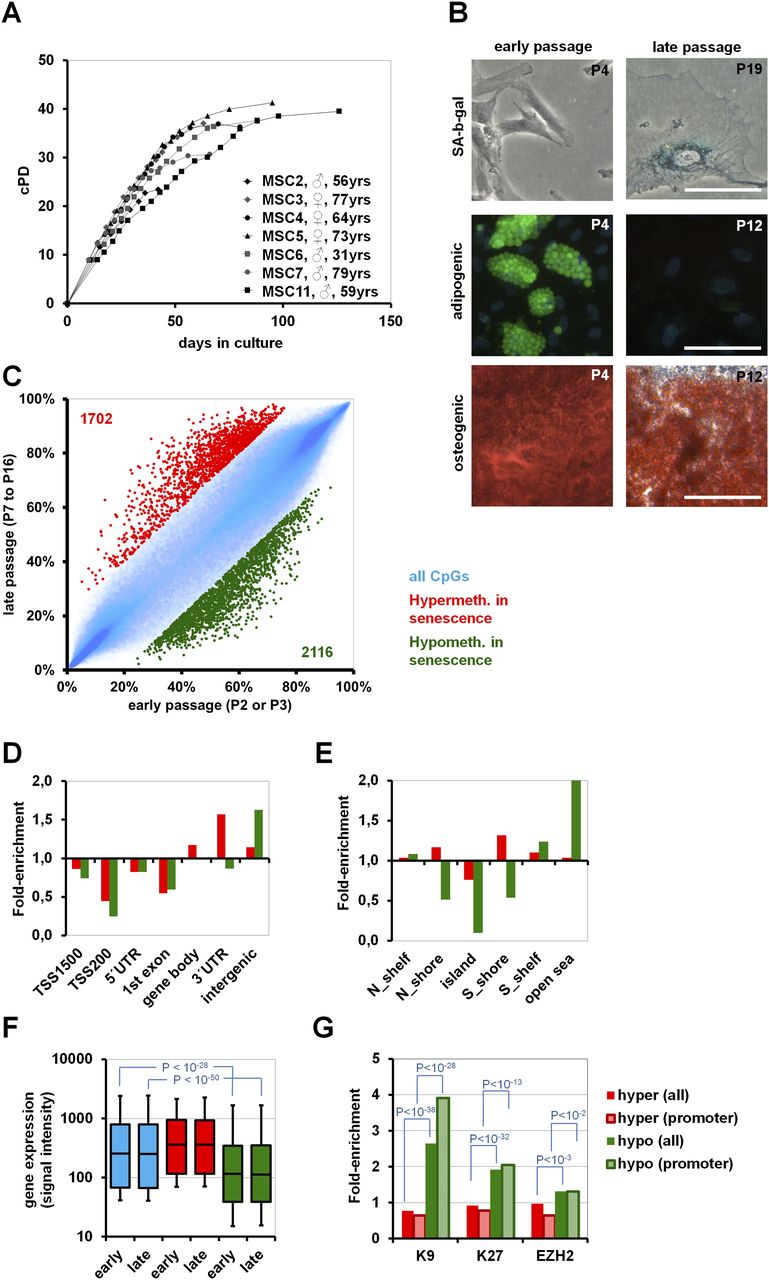
Long-term culture-associated changes in MSC. (A) Long-term growth curves demonstrate that MSC reach a senescent state after 2–3 mo of culture expansion. (B) Cells at higher passage acquire morphological changes, senescence-associated beta-galactosidase staining, and loss of adipogenic differentiation potential (green: BODIPY-staining of lipid droplets; blue: DAPI) and decline in osteogenic differentiation potential (Alizarin Red staining of calcium phosphate precipitates; size bars 100 μm). (C) Comparison of DNAm between early (P2–P3) and late (P7–P16) passages. CpG sites with relevant SA-hypermethylation (red: 1702 CpG sites) and SA-hypomethylation (green: 2116 CpG sites) are depicted (adjusted P-value < 0.05 and DNAm change >20%). (D) SA-DNAm changes were classified according to gene regions, and (E) in relation to CpG islands. (F) Signal intensity of gene expression microarrays was used as an indicator for gene expression level. In particular, genes with SA-hypomethylated CpG sites were significantly less-expressed than the average. (G) Genes with SA-DNAm changes were subsequently mapped to genes with H3K9me3, H3K27me3 (Delbarre et al. 2010), and PRC2 targets (Wei et al. 2011) in human MSC. Enrichment analysis revealed that particularly genes with SA-hypomethylated CpG sites have been associated with these repressive histone marks. As an alternative, we focused on the subset of promoter-associated CpG sites (TSS1500, TSS200, or 5′UTR; striped bars), and this analysis also revealed association of genes with SA-hypomethylated CpG sites with those genes that have repressive histone marks (H3K9, P < 10−28; H3K27, P < 10−13; EZH2, P < 10−2).


