
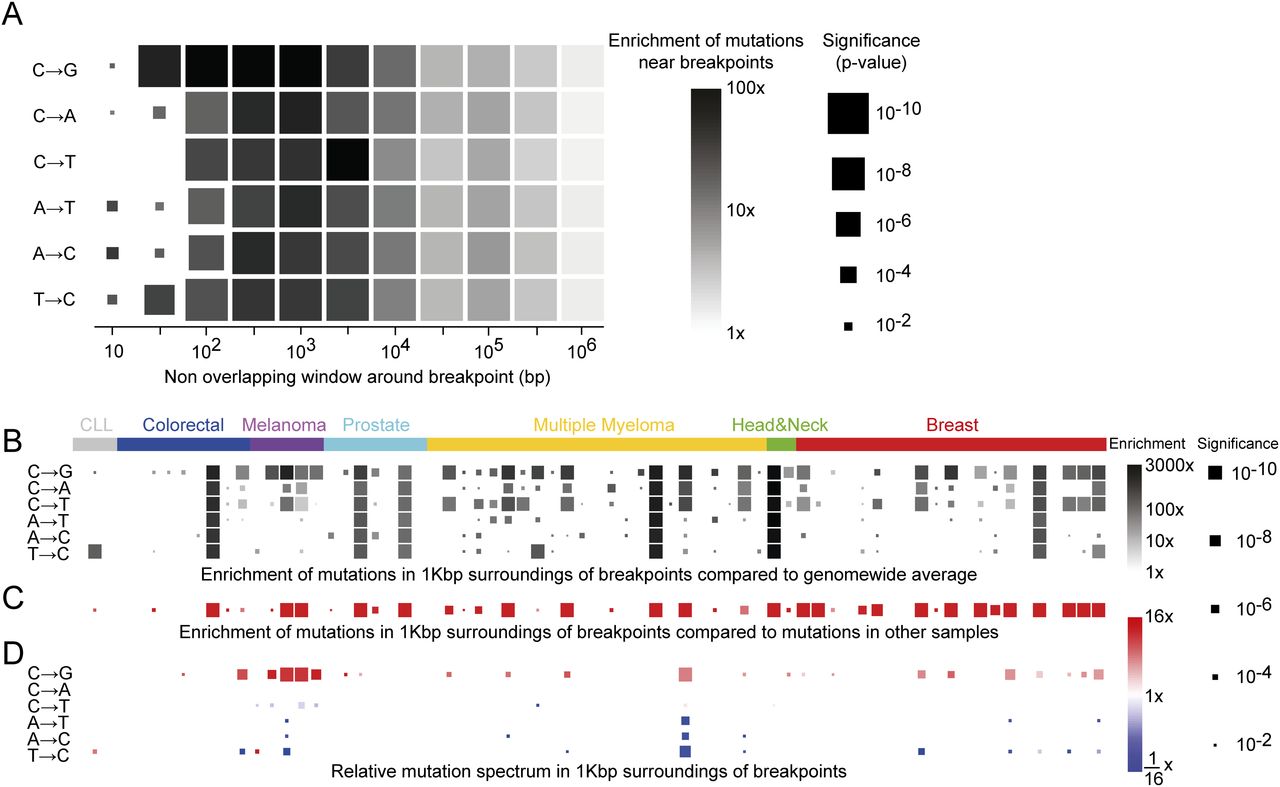
Hypermutability near breakpoints. (A) Enrichment of mutations across all samples by mutation type. Square represents mutation rate in concentric nonoverlapping
exponential windows around each breakpoint, compared with overall mutation rates in the 71 samples cohort, aggregating them
together. Size represents P-value, and color represents ratio. Only significant (FDR < 10%) results are shown. Hypermutation can be seen in a close proximity
of the breakpoint, but it is even stronger in 100 bp to 1 kb surroundings. (B) Similar analysis per sample in 1-kb windows reveals that for some samples the mutation rate can reach 1000×–3000× fold.
(C) Hypermutation is not only due to rearrangement and mutations occurring in the same “bad” regions of the genome. For each
sample we defined the 1-kb regions according to their rearrangements and measured the mutations in those regions in all other
samples of the same cancer type, aggregating them together. Squares represent P-value (by size) and ratio (by color) comparing the mutation rate in each selected sample to the mutation rate at the other
samples of the same cancer type. Any sample with significant hypermutation displays significant elevation in mutation rate
near breakpoints of that sample. (D) Mutation spectrum near breakpoints compared with spectrum across the genome of that sample. Hypermutated samples are often
skewed toward  transversions near breakpoints. Melanoma samples show depletion of
  transitions near breakpoints due to high
  transitions across the genome.


