
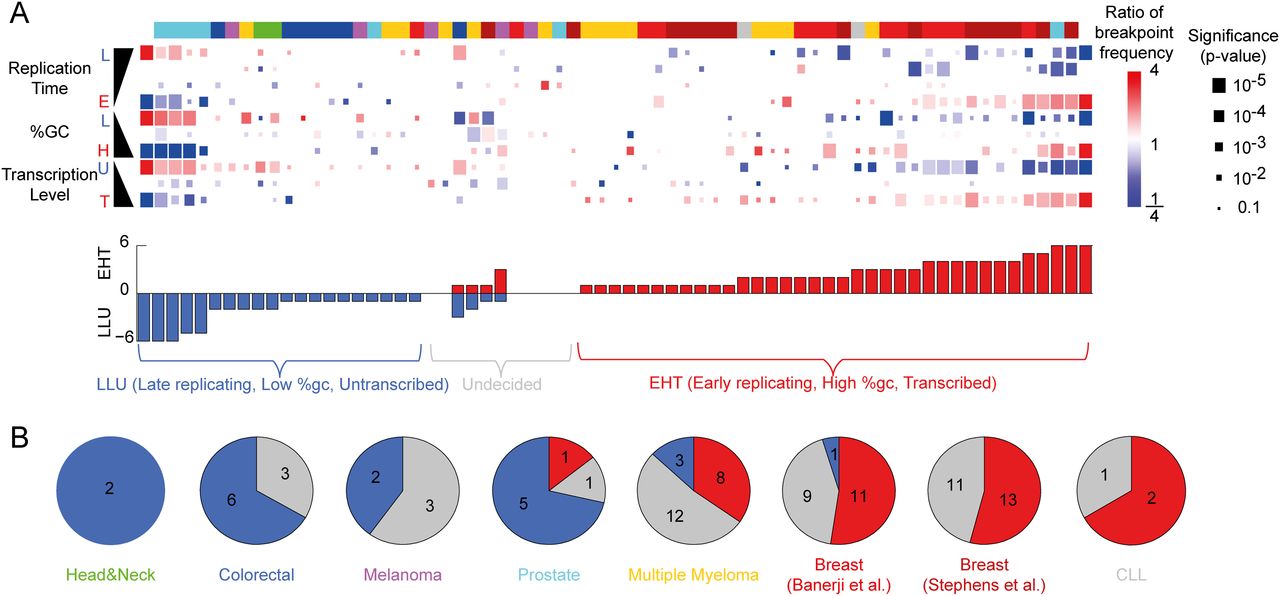
Breakpoint distribution as a function of transcription, replication, and GC content across samples. (A) Each row represents a different bin of replication time, GC content, or distance from transcribed gene. Each square represents significant (FDR < 10%) enrichment or depletion, size represents P-value, and color represents ratio. Only samples with at least one significant bin are shown. The colored bar above specifies the type of cancer for each sample. Most samples are either enriched for breakpoints in early replicating, high %GC transcribed regions of the genome (EHT), or in late replicating, low %GC untranscribed regions (LLU), as can be seen in the bar chart. The samples are sorted by the agreement with that pattern. (B) The breaking of each cancer to EHT (red), LLU (blue) and gray samples (without any significant extreme bin, or with contradicting enrichments).


