
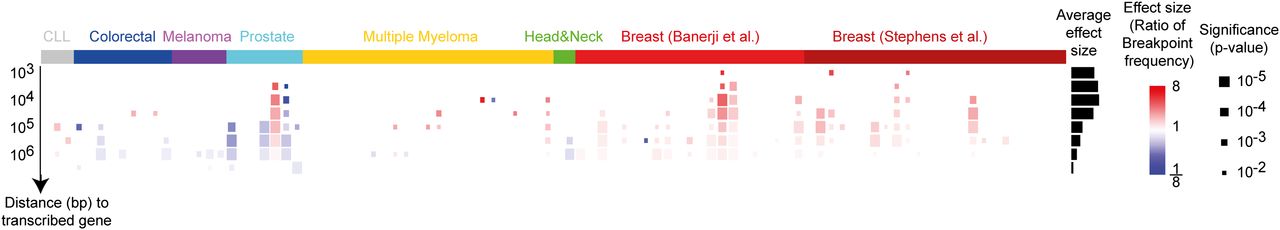
Figure 2.
Breakpoints in transcribed and untranscribed regions. Each square represents enrichment (red) or depletion (blue) of breakpoints in transcribed regions defined by maximal distance to transcribed gene. Size represents P-value, and color represents ratio. Only tests that passed 10% FDR are shown. Notice that regions of ∼104 bp were often significantly enriched or depleted. (Right) The average ratio (across samples). The colored bar above specifies the type of cancer for each sample.


