
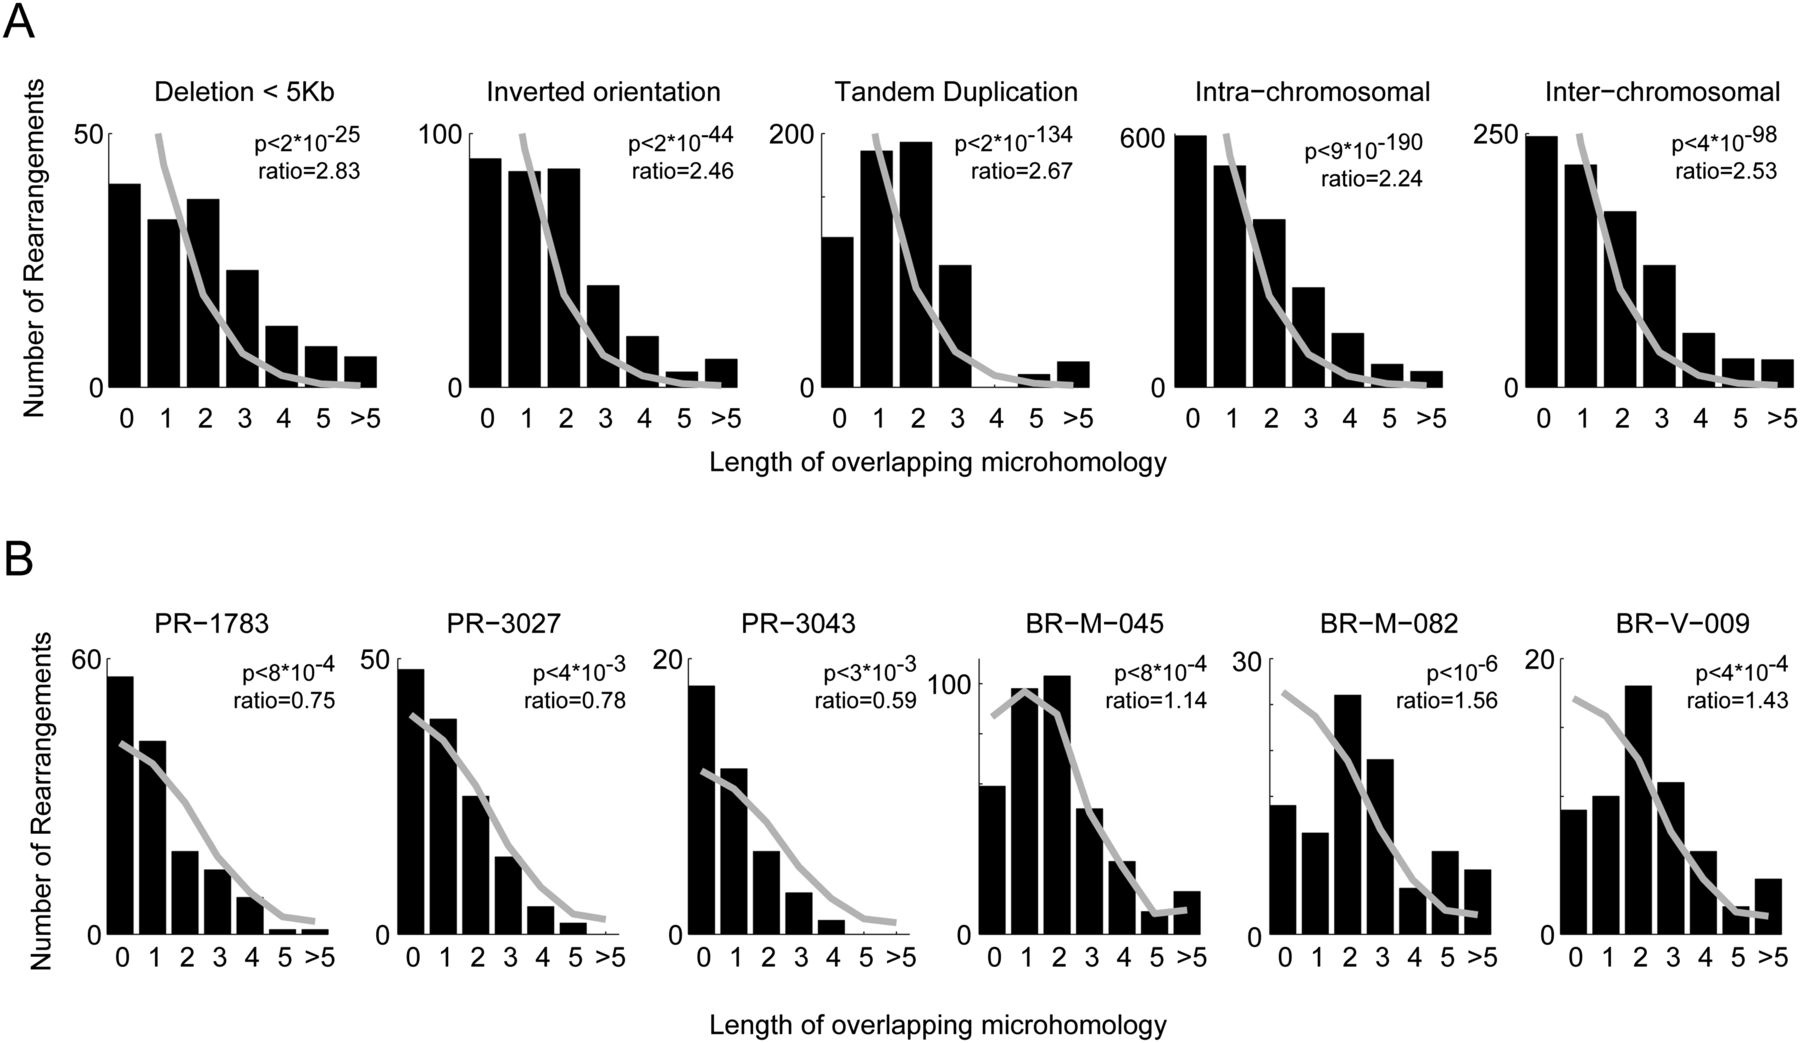
Overlapping microhomology. (A) By rearrangement type. (Gray line) The expected distribution, by permuting rearrangement pairs. All rearrangement types show higher microhomology than expected by chance. Tandem duplications display the highest microhomology rate with microhomology of length 2 being the most common case. Short deletions (up to 5 kb) and inversions show more microhomology than other rearrangements. Scholz-Stephens P-value for significant difference between histograms is <10−6. (B) Rearrangement count by sample for six extreme samples. (Gray line) The expected distribution, controlled for the composition of the different rearrangement types. The three prostate samples show less microhomology than expected (notice the high fraction of breakpoints with no microhomology), and the three breast samples show more (low fraction of breakpoints with no microhomology). Expected distribution was constructed to control for the different rearrangement types and the homologies they display in our cohort. These are the only samples passing FDR < 10% (and in fact satisfy FDR < 4%).


